
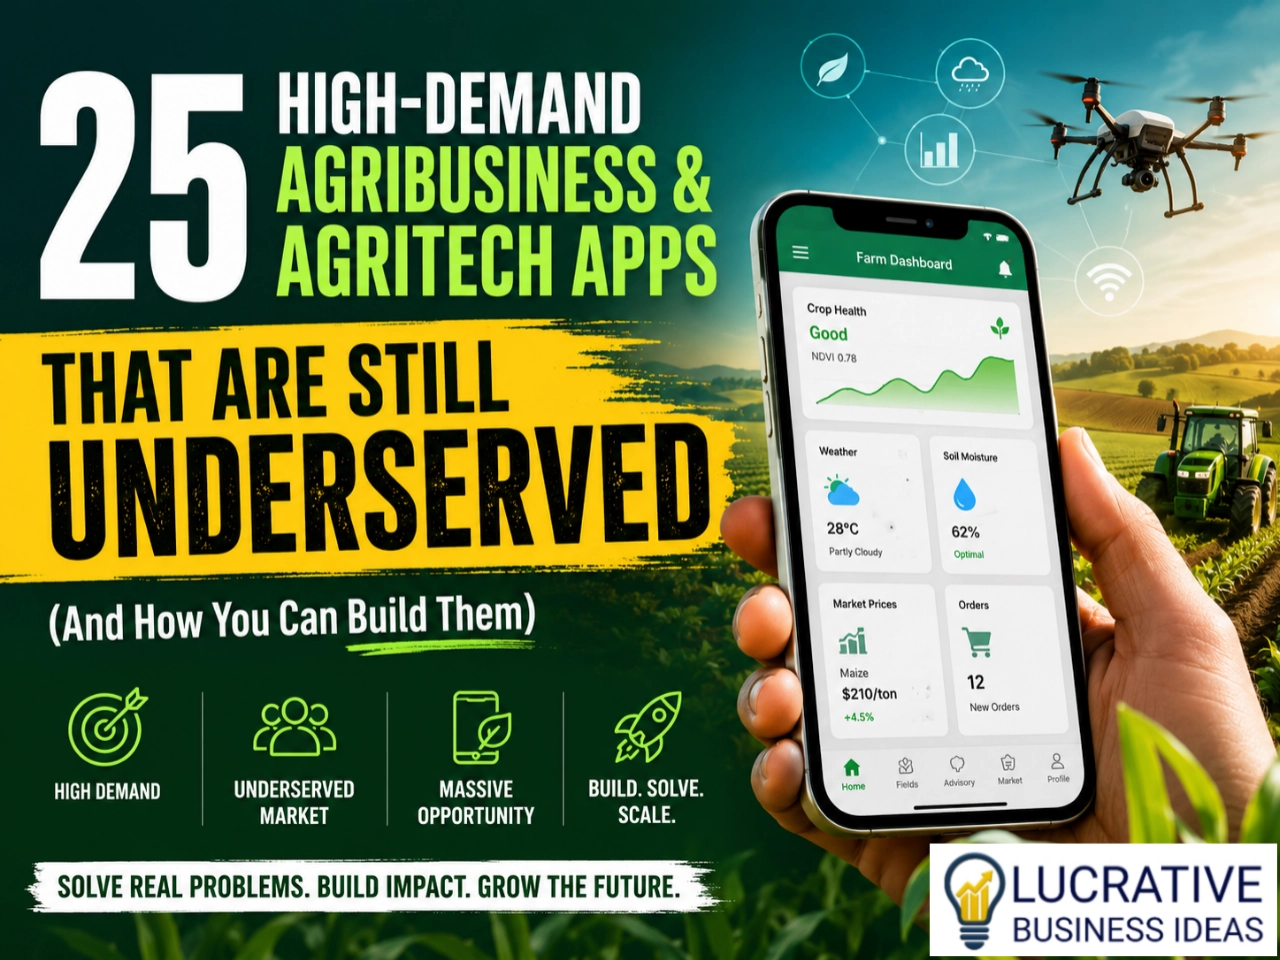
If you ask most people what agritech means, they immediately think of weather apps, farm record apps, drone apps, or marketplaces.
That is yesterday’s thinking.
The next generation of agritech will not be built by people trying to copy existing farm apps.
It will be built by developers who notice the painful problems that farmers, agribusiness owners, greenhouse operators, livestock producers, cooperatives, food processors, exporters, and agricultural investors still struggle with every day.
There are millions of farmers globally. There are thousands of agricultural software products. But there are still enormous gaps.
Many existing solutions are:
- too expensive
- designed for large industrial farms
- disconnected from local realities
- difficult to use
- poor at offline operation
- weak in business intelligence
- not designed for developing markets
This creates opportunity.
If you are both an Android developer and someone interested in agribusiness, this is one of the best times in history to build.
But you must stop thinking: “How do I build another farm app?”
Start asking: “What painful agricultural decision still takes too much time, money, or guesswork?”
That is where the real opportunities are.
Below are some of the most promising agribusiness and agritech app categories that are still underserved and likely to remain valuable for years.
The Agribusiness and Agritech Apps People Need But Are Not Very Much Available
1. AI Farm Business Advisor App
A virtual agribusiness consultant for farmers.
2. Greenhouse Economics Simulator
Predict greenhouse profitability before construction.
3. Crop Disease Diagnosis + Treatment Planner
Identify diseases and prescribe action plans.
4. Farm Investment ROI Calculator
Evaluate agricultural investments before spending.
5. Smart Irrigation Intelligence App
Water recommendation engine.
6. Farm Labor Management Platform
Track workers, tasks, and productivity.
7. Agricultural Market Demand Predictor
Forecast future product demand.
8. Farm Financial Intelligence Dashboard
Business accounting built specifically for farms.
9. AI Agronomist App
Continuous crop advisory assistant.
10. Agricultural Supply Chain Visibility Platform
Track products from farm to customer.
11. Livestock Health Early Warning App
Predict livestock illness before symptoms appear.
12. Soil Restoration Recommendation Engine
Suggest regenerative farming actions.
13. Agricultural Loan Readiness App
Prepare farmers for financing.
14. Smart Farm Construction Planner
Plan farm infrastructure before investment.
15. Greenhouse Climate Automation App
Automate greenhouse operations.
16. Post-Harvest Loss Prevention App
Reduce waste after harvest.
17. Agricultural Export Readiness Platform
Prepare farms for export markets.
18. AI Farm Cost Optimization App
Reduce operating expenses.
19. Agritech Equipment Sharing Marketplace
Rent agricultural equipment.
20. Precision Fertilizer Recommendation App
Generate field-specific fertilizer plans.
21. Agricultural Insurance Intelligence App
Estimate agricultural risks.
22. Agricultural Project Feasibility Builder
Test project viability.
23. Farm Digital Twin Simulator
Create virtual farms for decision making.
24. Farm Energy Optimization Platform
Reduce electricity and fuel costs.
25. Agribusiness Opportunity Discovery App
Recommend profitable agricultural ventures.
What Happens Next?
For each of these apps, we will break down:
- what it does
- how it functions
- required skills
- architecture
- Android stack
- backend
- AI models
- database
- MVP strategy
- cost-effective build path
- monetization
- scaling roadmap
One app at a time.
NOTE: Before you continue we made three assumptions:
- You are planning to build these apps as Android + iOS + Web (full platform).
- Your current technical level is Intermediate Android developer.
- Your goal is to build cost-effectively but with startup-grade architecture.
That changes the strategy completely.
You are not building small utility apps.
You are building platform businesses.
Since you already have intermediate Android development skills and want Android + iOS + Web, I will optimize the series for:
- Single codebase where possible
- Low initial cost
- Fast MVP launch
- Scalable architecture
- Production-ready decisions
- Agritech startup thinking
My default stack recommendations for this series will be:
Frontend
- Flutter (Android + iOS + Web)
Backend
- Supabase (early stage)
- Move selected services to NestJS or Go later
AI Layer
- OpenAI API / open-source models
- Retrieval-Augmented Generation (RAG)
Database
- PostgreSQL
Storage
- Supabase Storage
Maps & Location
- Mapbox
Analytics
- PostHog
Notifications
- Firebase Cloud Messaging
Infrastructure
- Cloudflare + Docker + VPS initially
Payments
- Stripe + regional payment gateways
App #1 — AI Farm Business Advisor App
The Agritech App That Could Become Every Farmer’s Virtual Consultant.
Why This App Opportunity Exists
Most farmers do not fail because they cannot farm.
They fail because they make business decisions with incomplete information.
Questions farmers constantly ask:
- What crop should I grow?
- Is greenhouse farming profitable here?
- How much capital do I need?
- What yield should I expect?
- Should I expand now?
- Which market should I target?
- Why am I losing money?
Today those answers usually come from:
- random WhatsApp groups
- expensive consultants
- trial and error
- outdated assumptions
This creates a huge opportunity.
Build software that behaves like an agribusiness consultant.
Not a chatbot. A decision engine.
What This App Is
An AI-powered business advisor that helps farmers make better agricultural decisions.
Users enter:
- location
- farm size
- capital
- crop type
- production method
- labor availability
- climate
- goals
The app generates:
- business recommendations
- financial projections
- risk analysis
- action plans
- market opportunities
- operating schedules
Think: ChatGPT × Farm ERP × Business Consultant.
Core Features
1. Farm Profile Engine
Collect:
- farm type
- available land
- equipment
- irrigation
- budget
- target customers
Output:
Personalized recommendations.
2. Profitability Calculator
Inputs:
- expected yield
- costs
- selling price
Outputs:
- revenue
- margin
- ROI
- break-even
3. AI Decision Assistant
User asks: “Should I plant tomatoes in rainy season?”
System returns:
- analysis
- opportunities
- risks
- recommendation
4. Market Opportunity Scanner
Shows:
- products with rising demand
- estimated pricing
- opportunity ranking
5. Farm Action Planner
Outputs:
Week-by-week execution plan.
6. Benchmark Dashboard
Compare:
- your farm
- regional averages
- industry standards
How The App Functions (Architecture)
User
↓
Flutter App
↓
API Gateway
↓
Business Rules Engine
↓
AI Layer
↓
Database
↓
Analytics
↓
Recommendation Engine
Suggested Technology Stack
- Frontend: Flutter
- State Management: Riverpod
- Backend: Supabase
- Database: PostgreSQL
- Authentication: Supabase Auth
- AI: OpenAI API
- Charts: fl_chart
- Cloud: Cloudflare
- Notifications: Firebase
- Analytics: PostHog
Knowledge And Skills Required
Essential
- Flutter
You already have Android experience.
Now master:
- responsive UI
- state management
- web deployment
Estimated: 4–8 weeks.
- Backend APIs
Learn:
- REST
- authentication
- database modeling
Estimated: 3–6 weeks.
- PostgreSQL
Learn:
- joins
- indexing
- query optimization
Estimated: 2–4 weeks.
- Prompt Engineering
Learn:
- structured prompts
- evaluation
- context design
Estimated: 2 weeks.
- Agricultural Economics
Learn:
- ROI
- break-even
- enterprise budgeting
Estimated: ongoing.
How to Build It (MVP Plan)
Phase 1 — MVP (4–6 Weeks)
Build:
✔ Login
✔ Farm profile
✔ AI chat
✔ ROI calculator
✔ Dashboard
Launch.
Do not build:
✘ IoT
✘ Drones
✘ Satellite integrations
✘ Complex ML
Phase 2 — Intelligence Layer
Add:
- forecasting
- recommendation engine
- memory
Phase 3 — Growth
Add:
- marketplace
- financing
- insurance
Cost-Effective Way to Build
Cheapest Realistic Build
- Design: Figma
- Frontend: Flutter
- Backend: Supabase Free
- AI: API pay-as-you-go
- Hosting: Cloudflare
- Analytics: PostHog
- Estimated MVP Cost: $100–$500
- Time: 30–60 days.
Monetization
- Freemium – Free: basic analysis
- Pro: advanced reports
- Enterprise: large farms
- Consultant Marketplace: commission model
Final Developer Advice
Do not build features. Build decisions.
Farmers do not buy software. They buy certainty.
App #2 — Greenhouse Economics Simulator
The Agritech App That Helps Farmers Calculate Profit Before They Build.
Why This App Opportunity Exists
One of the most expensive mistakes in agriculture happens before the first seed is planted.
People build greenhouses without understanding economics.
They ask:
- How many greenhouse units should I build?
- What size should I choose?
- Will my market absorb production?
- How long before I recover my investment?
- Should I use hydroponics or soil?
- Will electricity destroy profitability?
- What happens if prices drop?
Most people estimate. Very few simulate.
That is the opportunity.
Build software that allows farmers and investors to test greenhouse ideas before spending real money.
Think: Business Simulator × Financial Modeling × Agricultural Planning.
This app can become the agricultural equivalent of architectural planning software.
What This App Is
A financial and operational simulation platform for greenhouse projects.
Users input:
- location
- greenhouse dimensions
- crop
- growing system
- climate
- energy assumptions
- labor assumptions
- market assumptions
The app predicts:
- construction cost
- operating cost
- yield
- revenue
- cash flow
- break-even timeline
- risk exposure
- expected profitability
The goal:
- Help users decide: “Should I build this greenhouse?” before they spend.
Core Features
1. Greenhouse Configuration Builder
User selects:
- greenhouse type
- dimensions
- covering material
- ventilation
- irrigation
- automation level
System calculates:
- estimated capital expenditure
2. Production Yield Simulator
Inputs:
- crop
- cycles
- plant density
- climate assumptions
Outputs:
- estimated yield
- harvest schedule
- productivity score
3. Financial Projection Engine
Calculates:
- CAPEX
- OPEX
- monthly costs
- projected revenue
- ROI
- payback period
4. Scenario Comparison Tool
User compares:
Scenario A: Low-tech greenhouse
vs
Scenario B: Semi-automated greenhouse
vs
Scenario C: Fully automated greenhouse
Outputs:
- investment comparison
- profitability comparison
5. Energy Cost Simulator
Models:
- electricity
- fuel
- solar offset
- backup power
Outputs:
Expected operating cost.
6. Sensitivity Analysis Engine
User changes:
- selling price
- input cost
- yield
System shows:
- best case
- expected case
- worst case
This feature alone can become your competitive advantage.
How The App Functions
User Inputs
↓
Simulation Engine
↓
Economic Model
↓
Yield Model
↓
Financial Engine
↓
Scenario Comparison
↓
Dashboard
↓
Recommendations
Suggested Technology Stack
- Frontend: Flutter
- State Management: Riverpod
- Charts: fl_chart
- Backend: Supabase
- Database: PostgreSQL
- Cloud Functions: Supabase Edge Functions
- Math Processing: Server-side calculations
- Storage: Supabase Storage
- Analytics: PostHog
- Notifications: Firebase
- Deployment: Docker + Cloudflare
Required Knowledge And Skills
1. Financial Modeling
Learn:
- cash flow
- NPV
- ROI
- payback period
- sensitivity analysis
Estimated: 2–3 weeks.
2. Agricultural Economics
Learn:
- greenhouse budgeting
- production economics
- crop cycles
Estimated: ongoing.
3. Simulation Logic
Learn:
- decision trees
- formula engines
- parameter modeling
Estimated: 3–5 weeks.
4. Flutter Advanced UI
Learn:
- tables
- sliders
- dashboards
- responsive layouts
Estimated: 3–4 weeks.
5. Data Engineering
Learn:
- data structures
- aggregation
- historical analysis
Estimated: 2–4 weeks.
Database Structure (Simplified)
Users
↓
Projects
↓
Greenhouses
↓
Crop Plans
↓
Cost Records
↓
Simulation Results
↓
Reports
How To Build It (MVP Plan)
Phase 1 — Validation MVP (4–5 Weeks)
Build:
✔ Login
✔ Greenhouse setup wizard
✔ Cost calculator
✔ ROI engine
✔ Result dashboard
Launch.
Do not build:
✘ AI recommendations
✘ IoT integration
✘ Sensor dashboards
✘ Satellite feeds
Phase 2 — Simulation Expansion
Add:
- multi-season forecasts
- scenario comparison
- energy simulation
Phase 3 — Intelligence Layer
Add:
- AI recommendations
- market demand predictions
- automatic optimization
Cost-Effective Way To Build
Lowest-Cost Professional Stack
- UI: Figma
- Frontend: Flutter
- Backend: Supabase
- Hosting: Cloudflare
- Reporting: PDF generation
- Charts: fl_chart
- Estimated MVP Cost: $150–$700
- Development Time: 45–75 days
Monetization
Free
- 1 simulation/month
Professional
- unlimited simulations
Consultant
- branded reports
Enterprise
- team collaboration
Additional Revenue:
- greenhouse supplier listings
- financing referrals
- training marketplace
Competitive Advantage Strategy
Do not compete with greenhouse management apps.
Compete with uncertainty.
People are willing to pay before investing $10,000–$500,000 into infrastructure.
Reduce uncertainty.
That becomes your product.
App #3 — Crop Disease Diagnosis + Treatment Planner
The Agritech App That Does More Than Identify Diseases.
Why This App Opportunity Exists
Every season, farmers lose enormous amounts of money because disease is detected too late.
The typical process today looks like this:
Plant becomes unhealthy
↓
Farmer guesses
↓
Searches social media
↓
Gets conflicting advice
↓
Applies wrong treatment
↓
Yield drops
↓
Money is lost
Many existing apps stop after saying:
“Your plant may have early blight.”
That is incomplete.
Farmers need answers like:
- How serious is it?
- What should I do now?
- How urgent is treatment?
- What happens if I wait?
- How much will treatment cost?
- Is this spreading?
Your opportunity is to build a decision support system, not just an image classifier.
What This App Is
A mobile and web platform that helps users:
- detect crop diseases
- assess severity
- recommend treatment options
- estimate financial impact
- track recovery
Users upload:
- photos
- crop information
- location
- growth stage
- environmental conditions
The app returns:
- probable diagnosis
- confidence score
- severity level
- treatment plan
- prevention strategy
- expected recovery timeline
Think: Camera × AI × Agronomist × Action Plan.
Core Features
1. Disease Detection Camera
User:
Opens camera
↓
Photographs plant
↓
Uploads image
System analyzes:
- leaves
- stems
- fruit
- visible symptoms
Output:
Disease candidates.
2. Severity Assessment Engine
Do not stop at detection.
Estimate:
- infection level
- spread probability
- urgency
Outputs:
- Low Risk
- Medium Risk
- High Risk
- Critical
3. Treatment Planner
Generate:
Immediate actions
↓
Short-term actions
↓
Prevention steps
Example:
Today: Remove infected leaves
This week: Adjust irrigation
Next cycle: Change spacing
4. Recovery Tracking
User uploads images over time.
System shows:
- improvement
- decline
- treatment effectiveness
5. Cost Impact Calculator
Estimate:
- projected yield loss
- treatment cost
- expected recovery value
6. Offline Diagnosis Mode
Critical feature.
Allow:
- basic diagnosis without internet.
This is a huge advantage in rural markets.
How The App Functions
Image Capture
↓
Image Compression
↓
AI Inference
↓
Disease Classifier
↓
Severity Model
↓
Treatment Engine
↓
Recommendation Generator
↓
Dashboard
Recommended Architecture
- Frontend: Flutter
- Backend: Supabase
- Image Storage: Cloud Storage
- AI Inference: Server + On-device
- Database: PostgreSQL
- Background Jobs: Edge Functions
- Analytics: PostHog
- Notifications: Firebase
AI Stack Recommendation
Stage 1 — Fast MVP
Use:
Image classification API
Purpose:
Validate demand.
No training required.
Stage 2 — Custom Model
Train:
Crop disease classifier
Recommended:
TensorFlow
PyTorch
YOLO
Outputs:
Disease probability.
Stage 3 — Hybrid Intelligence
Combine:
Image analysis
Rules
AI recommendations
This is where product quality jumps.
Required Knowledge And Skills
1. Computer Vision
Learn:
- image classification
- segmentation
- object detection
Estimated: 4–8 weeks.
2. Machine Learning
Learn:
- model training
- evaluation
- deployment
Estimated: 6–10 weeks.
3. Flutter Image Pipeline
Learn:
- camera integration
- compression
- upload
- caching
Estimated: 2 weeks.
4. Agricultural Pathology
Learn:
- disease symptoms
- crop cycles
- treatment logic
Estimated: ongoing.
5. Edge AI
Learn:
- TensorFlow Lite
- model optimization
Estimated: 3–4 weeks.
How To Build It (MVP Plan)
Phase 1 — Validation MVP (30–45 Days)
Build:
✔ Login
✔ Camera
✔ Image upload
✔ Disease prediction
✔ Basic treatment
Launch.
Do not build:
✘ Offline AI
✘ Recovery tracking
✘ Advanced forecasting
Phase 2 — Decision Layer
Add:
- severity scoring
- treatment workflows
- alerts
Phase 3 — Intelligence Layer
Add:
- offline mode
- seasonal prediction
- disease forecasting
Suggested Database Design
Users
↓
Farms
↓
Crops
↓
Disease Records
↓
Images
↓
Treatments
↓
Recovery Logs
↓
Reports
Cost-Effective Way To Build
Lowest-Cost Production Path
- Frontend: Flutter
- Backend: Supabase
- AI: Cloud API initially
- Storage: Supabase Storage
- Inference: Server-side
- Estimated MVP Cost: $300–$1,500
- Time: 45–90 days
Do not train your own model first. Acquire users first.
Monetization
Free
- limited scans
Premium
- unlimited scans
Enterprise
- cooperatives
Additional Revenue:
- agronomist consultations
- treatment reports
- analytics subscriptions
Competitive Advantage Strategy
Do not build:
“Upload image → Disease name.”
Build:
“Upload image → What should I do next?”
That difference changes whether people try your app once or depend on it every season.
App #4 — Farm Investment ROI Calculator
App #4 — Farm Investment ROI Calculato
The Agribusiness App That Helps People Invest Before They Spend.
Why This App Opportunity Exists
Agriculture attracts huge interest.
But investment decisions are still heavily emotional.
People hear: “Fish farming is profitable.”
Then they invest.
People hear: “Greenhouse farming makes money.”
Then they build.
People hear: “Poultry is booming.”
Then they enter.
Months later they discover:
- costs were underestimated
- cash flow was ignored
- market timing was wrong
- payback took longer than expected
The problem is not lack of ambition.
The problem is poor investment modeling.
This app solves that.
What This App Is
A decision-support platform that estimates whether an agricultural investment is financially attractive before money is committed.
Users input:
- agricultural sector
- startup capital
- land availability
- operating assumptions
- expected pricing
- production timeline
- financing assumptions
The system produces:
- ROI
- break-even
- cash flow
- investment score
- risk profile
- sensitivity analysis
Think: Investment Calculator × Feasibility Consultant × Farm Economist.
Core Features
1. Agricultural Investment Builder
User selects:
- poultry
- greenhouse
- aquaculture
- crop production
- livestock
- processing
- agribusiness services
Inputs:
- investment amount
- timeline
- assumptions
Output:
Investment profile.
2. ROI Engine
Calculates:
Revenue
↓
Operating expenses
↓
Profit
↓
ROI
↓
Payback period
Example:
Investment: $10,000
Estimated ROI: 28%
Payback: 18 months
3. Cash Flow Simulator
Shows:
Month 1
↓
Month 2
↓
Month 3
↓
…
Users immediately see:
- cash shortages
- seasonal pressure
- funding gaps
4. Risk Analysis Engine
Models:
- input inflation
- market volatility
- disease risk
- weather impact
Outputs:
Risk score.
5. Scenario Comparison
Compare:
Scenario A: Manual operations
Scenario B: Semi-automation
Scenario C: Automation
Output:
Best investment option.
6. Venture Discovery Engine
User enters:
- Capital: $5,000
- Land: 2 hectares
- Goal: Income
System recommends:
Best agricultural opportunities.
This can become your signature feature.
How The App Functions
User Inputs
↓
Business Logic Engine
↓
Financial Models
↓
Risk Engine
↓
Scenario Processor
↓
Visualization Layer
↓
Investment Report
Recommended Architecture
- Frontend: Flutter
- Backend: Supabase
- Database: PostgreSQL
- Computation: Backend Functions
- Reporting: Server-generated PDF
- Storage: Cloud Storage
- Notifications: Firebase
- Analytics: PostHog
- Hosting: Cloudflare
Financial Models To Implement
ROI
(Return − Cost) ÷ Cost
Payback Period
Investment ÷ Annual Cash Flow
Break-Even
Fixed Costs ÷ Contribution Margin
NPV
Discount future returns.
IRR
Measure investment attractiveness.
Sensitivity Analysis
Test:
Price changes
Cost changes
Yield changes
Required Knowledge And Skills
1. Financial Modeling
Learn:
- ROI
- NPV
- IRR
- break-even
- discounted cash flow
Estimated: 4 weeks.
2. Agricultural Economics
Learn:
- enterprise budgeting
- production economics
- cost structures
Estimated: ongoing.
3. Flutter Dashboard Development
Learn:
- charts
- financial UI
- reporting
Estimated: 2–3 weeks.
4. Backend Computation
Learn:
- calculation services
- asynchronous jobs
Estimated: 2–4 weeks.
5. Data Visualization
Learn:
- financial presentation
- executive reporting
Estimated: 1–2 weeks.
Suggested Database Design
Users
↓
Investment Projects
↓
Assumptions
↓
Operating Costs
↓
Revenue Forecasts
↓
Scenarios
↓
Risk Models
↓
Reports
How To Build It (MVP Plan)
Phase 1 — Validation MVP (30–45 Days)
Build:
✔ User login
✔ Investment form
✔ ROI calculator
✔ Break-even
✔ Report generation
Launch.
Do not build:
✘ AI recommendations
✘ Market forecasting
✘ Banking integrations
✘ Portfolio tracking
Phase 2 — Financial Intelligence
Add:
- scenario analysis
- venture recommendation
- historical comparisons
Phase 3 — Investor Platform
Add:
- portfolio tools
- collaboration
- financing integrations
Cost-Effective Way To Build
Practical Startup Stack
- Design: Figma
- Frontend: Flutter
- Backend: Supabase
- Reporting: PDF exports
- Hosting: Cloudflare
- Charts: fl_chart
- Estimated MVP Cost: $100–$600
- Estimated Build Time: 30–60 days
Avoid building custom financial engines initially.
Use formula-driven architecture.
Monetization
Free
- limited investment calculations
Pro
- advanced simulations
Enterprise
- consultants and firms
Additional Revenue:
- feasibility report marketplace
- financing referrals
- investor subscriptions
Competitive Advantage Strategy
Most agricultural apps help people operate farms.
Build one that helps people decide whether to invest at all.
People gladly pay for software that saves them from expensive mistakes.
That is the business.
App #5 — Smart Irrigation Intelligence App
The Agritech App That Helps Farmers Decide Exactly When, Where, and How Much to Water.
Why This App Opportunity Exists
Most irrigation decisions are still based on:
- habit
- guesswork
- calendar schedules
- visual observation
Typical decisions:
“Water every morning.”
“Run irrigation for two hours.”
“Rain may come tomorrow.”
That approach creates hidden losses.
Overwatering can cause:
- root diseases
- nutrient leaching
- higher electricity bills
- lower oxygen availability
Underwatering can cause:
- poor yield
- stress
- quality loss
The future is not automated watering.
The future is intelligent watering.
That is the opportunity.
What This App Is
A decision-support and automation platform that determines:
- when irrigation should happen
- how much water should be applied
- irrigation duration
- irrigation efficiency
- expected water demand
Users connect:
- farm information
- crop data
- weather
- optional sensors
- irrigation equipment
The system produces:
- irrigation recommendations
- schedules
- alerts
- optimization reports
Think: Weather Intelligence × Sensor Platform × Farm Automation.
Core Features
1. Smart Irrigation Recommendation Engine
Inputs:
- crop
- growth stage
- soil type
- temperature
- rainfall
- irrigation system
Outputs:
Water recommendation.
Example:
Recommended today: 12 mm
Duration: 28 minutes
Next irrigation: Tomorrow morning
2. Weather-Aware Irrigation
System adjusts recommendations based on:
- rainfall probability
- humidity
- temperature
- evaporation
Goal:
Avoid watering before rain.
3. Sensor Integration (Optional)
Connect:
- soil moisture sensors
- flow meters
- temperature sensors
- humidity sensors
Outputs:
Live field conditions.
Important:
Do not build this first. Build software-first.
4. Automated Irrigation Control
User enables:
Auto Mode
System:
Evaluate
↓
Decide
↓
Trigger irrigation
↓
Monitor results
5. Water Consumption Analytics
Show:
- daily usage
- weekly usage
- cost trends
- efficiency score
This becomes addictive for users.
6. Irrigation Alert System
Notify users:
- irrigation missed
- excessive watering
- water shortage
- abnormal consumption
7. Multi-Farm Management
Allow users to manage:
Farm A
Farm B
Farm C
From one dashboard.
Huge advantage for commercial operations.
How The App Functions
Weather
Farm Inputs
Sensors (optional)
↓
Decision Engine
↓
Recommendation Model
↓
Schedule Generator
↓
Automation Layer
↓
Dashboard
Recommended Architecture
- Frontend: Flutter
- Backend: Supabase
- Database: PostgreSQL
- Real-Time: Supabase Realtime
- IoT: MQTT
- Functions: Edge Functions
- Storage: Cloud Storage
- Analytics: PostHog
- Notifications: Firebase
- Hosting: Cloudflare
Recommended IoT Stack (Later Stage)
- Microcontroller: ESP32
- Communication: MQTT
- Gateway: Raspberry Pi
- Protocol: HTTP + MQTT
- Cloud: Supabase
Do not buy industrial hardware first.
Prototype cheaply.
Required Knowledge And Skills
1. Flutter Cross-Platform Development
Learn:
- responsive layouts
- real-time updates
- background sync
Estimated: 2–3 weeks.
2. Agricultural Water Management
Learn:
- evapotranspiration
- crop coefficients
- irrigation scheduling
Estimated: 3–5 weeks.
3. IoT Fundamentals
Learn:
- sensors
- MQTT
- edge computing
Estimated: 4–6 weeks.
4. Backend Architecture
Learn:
- event-driven systems
- streaming
- queues
Estimated: 3–5 weeks.
5. Analytics Engineering
Learn:
- dashboards
- aggregation
- anomaly detection
Estimated: 2–4 weeks.
Suggested Database Design
Users
↓
Farms
↓
Fields
↓
Crops
↓
Weather Records
↓
Irrigation Events
↓
Sensors
↓
Recommendations
↓
Alerts
How To Build It (MVP Plan)
Phase 1 — Software MVP (30–45 Days)
Build:
✔ Login
✔ Farm setup
✔ Irrigation calculator
✔ Scheduling
✔ Notifications
Launch.
Do not build:
✘ Sensors
✘ Automation
✘ Hardware
✘ AI
This surprises many developers.
Software validation first.
Phase 2 — Intelligence Layer
Add:
- weather adaptation
- analytics
- forecasting
Phase 3 — IoT Expansion
Add:
- sensors
- automation
- remote control
Cost-Effective Way To Build
Lean Startup Stack
Frontend: Flutter
Backend: Supabase
Hosting: Cloudflare
Notifications: Firebase
Charts: fl_chart
Estimated MVP Cost: $100–$700
Estimated Build Time: 45–75 days
If adding prototype hardware:
Add: $50–$200
for initial testing.
Monetization
Free
- one farm
Pro
- multiple farms
Enterprise
- large operations
Additional Revenue:
- irrigation hardware
- analytics subscriptions
- consulting
- water optimization reports
Competitive Advantage Strategy
Do not sell irrigation.
Sell lower water bills.
Sell yield stability.
Sell fewer mistakes.
People rarely buy sensors.
People buy confidence that crops will not fail.
App #6 — Farm Labor Management Platform
The Agritech App That Helps Farms Manage People Like High-Performance Operations.
Why This App Opportunity Exists
Farm productivity is often treated as an agronomy problem.
In reality, many farms lose money because of operational inefficiency.
Examples:
Workers arrive late.
↓
Tasks are unclear.
↓
Field teams duplicate work.
↓
Managers cannot verify progress.
↓
Payroll becomes inaccurate.
↓
Costs rise.
This problem exists across:
- crop farms
- greenhouse operations
- livestock farms
- plantations
- fisheries
- processing facilities
Yet there are surprisingly few labor systems designed specifically for agriculture.
That gap is your opportunity.
What This App Is
A workforce management platform designed for agricultural operations.
The app helps farms:
- organize workers
- assign tasks
- monitor execution
- track attendance
- calculate labor costs
- improve productivity
Users:
- farm owners
- supervisors
- field workers
- contractors
Think: Work Management × GPS × Payroll × Operations Intelligence.
Core Features
1. Workforce Directory
Create profiles for:
- permanent staff
- seasonal workers
- contractors
- supervisors
Track:
- skills
- assignments
- availability
2. Task Assignment Engine
Managers create:
Task
↓
Location
↓
Worker
↓
Deadline
Workers receive instructions.
Example:
Harvest Block C
Start: 7:00 AM
Target: 600 kg
3. Attendance System
Methods:
- QR check-in
- GPS validation
- supervisor approval
Outputs:
Daily attendance logs.
4. Productivity Tracking
Measure:
- hours worked
- output completed
- efficiency
Examples:
Harvest: kg per worker
Planting: rows completed
Greenhouse: beds maintained
5. Payroll Intelligence
Automatically calculate:
- wages
- overtime
- incentives
- deductions
Huge operational value.
6. Field Reporting
Workers submit:
- photos
- notes
- completion updates
Managers see progress instantly.
7. Workforce Analytics Dashboard
Show:
- labor cost trends
- productivity trends
- absenteeism
- performance rankings
This becomes management’s favorite screen.
How The App Functions
Worker
↓
Task Assignment
↓
Execution
↓
Attendance
↓
Reporting
↓
Analytics
↓
Payroll
↓
Insights
Recommended Architecture
- Frontend: Flutter
- Backend: Supabase
- Database: PostgreSQL
- Realtime: Supabase Realtime
- Authentication: Role-Based Access
- Storage: Cloud Storage
- Notifications: Firebase
- Maps: Mapbox
- Hosting: Cloudflare
Advanced Architecture (Later Stage)
Add:
Event Queue
↓
Analytics Pipeline
↓
Productivity Engine
↓
Reporting Service
↓
Forecasting
Useful for large operations.
Required Knowledge And Skills
1. Flutter Enterprise UI
Learn:
- complex forms
- tables
- dashboards
Estimated: 3–4 weeks.
2. Workforce System Design
Learn:
- task lifecycle
- user roles
- approvals
Estimated: 2 weeks.
3. Geolocation Systems
Learn:
- GPS
- geofencing
- map rendering
Estimated: 2–4 weeks.
4. Backend Architecture
Learn:
- authentication
- permissions
- real-time systems
Estimated: 3–5 weeks.
5. Reporting Systems
Learn:
- aggregation
- exports
- analytics
Estimated: 2 weeks.
Suggested Database Design
Users
↓
Organizations
↓
Farms
↓
Workers
↓
Tasks
↓
Attendance
↓
Work Logs
↓
Payroll
↓
Reports
↓
Analytics
How To Build It (MVP Plan)
Phase 1 — Validation MVP (30–45 Days)
Build:
✔ Login
✔ Worker profiles
✔ Task assignment
✔ Attendance
✔ Reports
Launch.
Do not build:
✘ Payroll automation
✘ GPS tracking
✘ Analytics engine
✘ AI forecasting
Keep version one operational.
Phase 2 — Productivity Layer
Add:
- dashboards
- worker insights
- performance metrics
Phase 3 — Intelligence Layer
Add:
- labor forecasting
- staffing optimization
- scheduling intelligence
Cost-Effective Way To Build
Lean Platform Stack
- Frontend: Flutter
- Backend: Supabase
- Maps: Mapbox
- Hosting: Cloudflare
- Notifications: Firebase
- Estimated MVP Cost: $150–$800
- Estimated Build Time: 45–90 days
Do not build custom payroll first.
Generate reports first.
Monetization
Free
- small teams
Pro
- advanced workforce tools
Enterprise
- large farms
Additional Revenue:
- payroll services
- operational consulting
- workforce benchmarking
Competitive Advantage Strategy
Most farm software tracks crops.
Build software that tracks execution.
A farm can have the perfect planting plan and still lose money if work is poorly managed.
Operations create outcomes.
App #7 — Agricultural Market Demand Predictor
The Agritech App That Predicts What People Will Want Before Farmers Produce It.
Why This App Opportunity Exists
One of agriculture’s biggest hidden risks is not poor production.
It is producing the wrong thing.
Every season this happens:
Farmers see high prices
↓
Everyone produces the same thing
↓
Supply floods the market
↓
Prices collapse
↓
Profit disappears
Meanwhile another product quietly becomes scarce.
Opportunity lost.
Most agricultural decisions still depend on:
- rumors
- social media
- old market reports
- local assumptions
That is not enough anymore.
People need demand intelligence.
That creates your opportunity.
What This App Is
A forecasting and market intelligence platform that helps users identify agricultural opportunities before market conditions change.
Users enter:
- region
- crop
- production timeline
- investment size
- target market
The system predicts:
- future demand
- price direction
- competition intensity
- market attractiveness
- profitability potential
Think: Bloomberg Terminal × Agriculture × Opportunity Scanner.
Core Features
1. Market Opportunity Scanner
User enters:
Location
↓
Category
↓
Timeline
System outputs:
Opportunity score.
Example:
Tomato
Demand: High
Competition: Medium
Expected Margin: Strong
2. Demand Forecast Engine
Estimate:
- rising demand
- stable demand
- declining demand
Display:
30 days
90 days
180 days
12 months
This becomes a major retention feature.
3. Agricultural Price Tracker
Monitor:
- wholesale prices
- retail trends
- historical movement
Outputs:
Price direction.
4. Competition Heatmap
Estimate:
- market saturation
- regional opportunity
- supply pressure
Useful for expansion decisions.
5. Production Timing Engine
Suggest:
Plant now
Delay planting
Reduce production
Expand production
This feature separates decision support from reporting.
6. Market Alerts
Notify users:
- sudden price changes
- shortages
- demand spikes
- market opportunities
7. Opportunity Discovery Feed
User enters:
- Budget: $2,000
- Location: Local region
- Goal: Fast turnover
System recommends:
Best agricultural opportunities.
Very powerful for engagement.
How The App Functions
Market Data
Historical Trends
Seasonality
User Inputs
↓
Forecast Engine
↓
Scoring Engine
↓
Recommendation Layer
↓
Dashboard
↓
Alerts
Recommended Architecture
- Frontend: Flutter
- Backend: Supabase
- Database: PostgreSQL
- Data Processing: Backend Jobs
- Forecasting: Python Services
- Caching: Redis
- Storage: Cloud Storage
- Analytics: PostHog
- Hosting: Cloudflare
Data Sources To Design For
Market Prices
↓
Production Trends
↓
Seasonality
↓
User Inputs
↓
Demand Signals
↓
Historical Performance
Important:
Do not start with huge datasets.
Start narrow.
One region.
One category.
Expand later.
Forecasting Models To Learn
Stage 1 — Rules + Analytics
Build:
Moving averages
Trend analysis
Simple forecasting
Fast to launch.
Stage 2 — Statistical Models
Learn:
- ARIMA
- Exponential smoothing
- time-series forecasting
Stage 3 — Intelligence Layer
Add:
- machine learning
- recommendation systems
- predictive ranking
Required Knowledge And Skills
1. Data Analytics
Learn:
- aggregation
- forecasting
- visualization
Estimated: 3–5 weeks.
2. Time-Series Modeling
Learn:
- seasonality
- trends
- projections
Estimated: 4–8 weeks.
3. Flutter Dashboard Design
Learn:
- filters
- charts
- interactive reports
Estimated: 2–3 weeks.
4. Backend Engineering
Learn:
- scheduled jobs
- processing pipelines
Estimated: 3–5 weeks.
5. Agricultural Market Economics
Learn:
- supply cycles
- pricing behavior
- market dynamics
Estimated: ongoing.
Suggested Database Design
Users
↓
Regions
↓
Products
↓
Price Records
↓
Demand Signals
↓
Forecast Models
↓
Recommendations
↓
Alerts
↓
Reports
How To Build It (MVP Plan)
Phase 1 — Validation MVP (45–60 Days)
Build:
✔ Login
✔ Market dashboard
✔ Price tracking
✔ Opportunity score
✔ Alerts
Launch.
Do not build:
✘ Machine learning
✘ AI chat
✘ Global expansion
✘ Complex prediction
Start with actionable insights.
Phase 2 — Forecast Expansion
Add:
- predictive reports
- opportunity feeds
- scenario analysis
Phase 3 — Intelligence Platform
Add:
- personalized forecasts
- AI recommendations
- automated planning
Cost-Effective Way To Build
Practical Startup Stack
- Frontend: Flutter
- Backend: Supabase
- Forecasting: Python microservice
- Caching: Redis
- Hosting: Cloudflare
- Charts: fl_chart
- Estimated MVP Cost: $300–$1,200
- Estimated Build Time: 60–90 days
Do not overbuild forecasting.
Users value useful direction more than perfect prediction.
Monetization
Free
- limited market tracking
Pro
- advanced forecasts
Enterprise
- agribusiness firms
Additional Revenue:
- premium reports
- export intelligence
- market subscriptions
Competitive Advantage Strategy
Most farm apps answer: “How do I grow?”
Build one that answers: “What should I grow next?”
That question controls profitability.
Production creates supply.
Demand creates income.
App #8 — Farm Financial Intelligence Dashboard
The Agritech App That Turns Farm Data Into Financial Decisions.
Why This App Opportunity Exists
Many agricultural businesses fail quietly.
Production appears healthy.
Harvest looks successful.
Sales happen.
But months later:
Cash disappears.
The problem?
No financial visibility.
Typical farm operators struggle to answer:
- Are we profitable?
- Which crop makes money?
- What activity burns cash?
- How long can we operate?
- Where are margins shrinking?
- Which season performed best?
General accounting software rarely understands agriculture.
Agriculture has:
- seasonal cash cycles
- biological timelines
- delayed revenue
- variable production costs
- weather-driven volatility
That creates your opportunity.
Build finance software designed for farms.
What This App Is
A financial operating system that helps agricultural businesses track performance and make smarter decisions.
Users connect:
- expenses
- revenue
- operations
- production
- inventory
- labor
The system produces:
- profitability reports
- cash flow analysis
- forecasting
- financial alerts
- executive dashboards
Think: Farm ERP × Financial Analytics × Business Intelligence.
Core Features
1. Farm Financial Dashboard
Display:
Revenue
↓
Expenses
↓
Profit
↓
Cash Position
↓
Performance Score
The dashboard should answer: “How is the farm doing today?”
within seconds.
2. Expense Tracking Engine
Track:
- seed
- fertilizer
- feed
- labor
- fuel
- equipment
- utilities
Outputs:
Cost categories.
3. Revenue Intelligence
Track:
- sales
- customers
- contracts
- recurring income
Show:
Revenue trends.
4. Profitability Analysis
Calculate Profit by:
- crop
- greenhouse
- field
- production cycle
This feature creates real business value.
5. Cash Flow Forecasting
Estimate:
Incoming
↓
Outgoing
↓
Expected cash position
Help users avoid liquidity problems.
6. Budget Management
Create:
Planned Budget
↓
Actual Spending
↓
Variance Analysis
7. Financial Alerts
Notify users:
- overspending
- unusual costs
- low cash reserves
- margin decline
8. Executive Reports
Generate:
Weekly
Monthly
Quarterly
Annual reports
PDF + dashboard formats.
How The App Functions
Transactions
Operations
Production Records
↓
Financial Engine
↓
Analytics
↓
Forecasting
↓
Dashboard
↓
Recommendations
Recommended Architecture
- Frontend: Flutter
- Backend: Supabase
- Database: PostgreSQL
- Reporting: Server-side generation
- Caching: Redis
- Storage: Cloud Storage
- Analytics: PostHog
- Notifications: Firebase
- Hosting: Cloudflare
Recommended Financial Modules
Accounting Layer
↓
Transaction Engine
↓
Cost Allocation
↓
Forecasting
↓
Reporting
↓
Insights
Build these as separate modules.
Required Knowledge And Skills
1. Financial Systems
Learn:
- accounting basics
- cash flow
- budgeting
- cost allocation
Estimated: 3–5 weeks.
2. Agricultural Economics
Learn:
- enterprise accounting
- production costing
Estimated: ongoing.
3. Flutter Dashboard Engineering
Learn:
- data-heavy UI
- filters
- reports
Estimated: 3 weeks.
4. Backend Data Modeling
Learn:
- transaction systems
- aggregation
Estimated: 3–5 weeks.
5. Analytics Development
Learn:
- KPIs
- forecasting
- business intelligence
Estimated: 3–4 weeks.
Suggested Database Design
Users
↓
Organizations
↓
Farms
↓
Transactions
↓
Revenue
↓
Expenses
↓
Budgets
↓
Forecasts
↓
Reports
↓
Insights
Example KPIs To Calculate
Gross Margin
↓
Operating Margin
↓
Cost Per Acre
↓
Cost Per Kilogram
↓
Cash Burn
↓
Revenue Growth
↓
Profit Trend
These metrics become product value.
How To Build It (MVP Plan)
Phase 1 — Validation MVP (45–60 Days)
Build:
✔ Login
✔ Transaction tracking
✔ Dashboard
✔ Expense categories
✔ Reporting
Launch.
Do not build:
✘ Double-entry accounting
✘ AI forecasting
✘ ERP integrations
✘ Audit systems
Version one should focus on visibility.
Phase 2 — Intelligence Layer
Add:
- forecasting
- budgeting
- benchmarking
Phase 3 — Executive Platform
Add:
- multi-company
- investor dashboards
- scenario analysis
Cost-Effective Way To Build
Lean Financial Stack
- Frontend: Flutter
- Backend: Supabase
- Database: PostgreSQL
- Charts: fl_chart
- Reporting: PDF exports
- Hosting: Cloudflare
- Estimated MVP Cost: $200–$900
- Estimated Build Time: 60–90 days
Build reports before accounting complexity.
Monetization
Free
- single farm
Professional
- advanced analytics
Enterprise
- multi-location management
Additional Revenue:
- financial consulting
- benchmarking subscriptions
- executive reporting
Competitive Advantage Strategy
Most farm software tracks activity.
Build software that tracks outcomes.
Farmers do not wake up asking: “How many tasks did we complete?”
They ask: “Did we actually make money?”
Answer that question better than everyone else.
App #9 — AI Agronomist App
The Agritech App That Becomes Every Farmer’s Continuous Crop Advisor.
Why This App Opportunity Exists
Farmers make dozens of decisions every season.
Examples:
- What should I plant?
- When should I transplant?
- Is growth normal?
- Why are leaves changing color?
- When should I irrigate?
- Should I apply fertilizer now?
- Is disease becoming a threat?
- Should I harvest this week?
Most decisions are made using:
- memory
- local habits
- fragmented advice
- delayed consultations
But agronomy is continuous.
One recommendation today affects outcomes weeks later.
That is why the future is not agricultural search.
The future is persistent agricultural intelligence.
That is the opportunity.
What This App Is
An AI-powered agronomic operating system that acts like a continuous advisor.
Users interact naturally.
The app learns farm context over time.
Inputs:
- crop
- location
- farm size
- growth stage
- weather
- historical activity
- observations
- images
Outputs:
- recommendations
- action plans
- alerts
- explanations
- schedules
Think: Agronomist × Memory × AI × Farm Operating System.
Core Features
1. Farm Memory Engine
Store:
- crops
- planting dates
- interventions
- yields
- observations
Example:
System remembers:
Tomatoes planted: April 14
Last fertilization: May 2
Last disease event: May 18
Recommendations become smarter.
This feature becomes a moat.
2. Conversational Agronomist
User asks: “My pepper leaves are curling.”
System asks follow-up questions.
Then produces:
- diagnosis
- possible causes
- action plan
Not generic answers. Context-driven answers.
3. Crop Lifecycle Advisor
Guide users through:
Planning
↓
Planting
↓
Growth
↓
Harvest
↓
Post-harvest
Every stage becomes interactive.
4. Recommendation Engine
Combine:
Farm History
Weather
Crop Rules
AI
Outputs:
Recommended actions.
Example:
Delay fertilizer application:
Expected rainfall tomorrow.
5. Observation Journal
User logs:
- images
- notes
- measurements
System detects patterns over time.
6. Alert Engine
Notify:
- growth anomalies
- delayed operations
- disease risk
- missed schedules
7. Learning System
Over time:
System improves recommendations.
This becomes increasingly valuable.
How The App Functions
User Inputs
Farm Context
Weather
Historical Records
↓
Knowledge Layer
↓
AI Layer
↓
Recommendation Engine
↓
Conversation
↓
Action Plan
Recommended Architecture
- Frontend: Flutter
- Backend: Supabase
- Database: PostgreSQL
- Vector Storage: pgvector
- AI: LLM + RAG
- Storage: Cloud Storage
- Realtime: Supabase
- Analytics: PostHog
- Notifications: Firebase
- Hosting: Cloudflare
Recommended AI Architecture
Layer 1
Farm Database
↓
Layer 2
Knowledge Base
↓
Layer 3
Retrieval Engine
↓
Layer 4
LLM
↓
Layer 5
Recommendation Layer
↓
Response
Do not send raw farm history directly into AI.
Retrieve only relevant context.
Knowledge System Design
Create knowledge categories:
Crop Library
↓
Disease Knowledge
↓
Soil Knowledge
↓
Agronomy Rules
↓
Farm Records
↓
Recommendations
This architecture scales.
Required Knowledge And Skills
1. Flutter Full-Platform Development
Learn:
- chat systems
- offline sync
- structured UI
Estimated: 3 weeks.
2. AI Engineering
Learn:
- LLM APIs
- prompt design
- embeddings
- retrieval
Estimated: 4–8 weeks.
3. RAG Architecture
Learn:
- vector search
- context retrieval
Estimated: 2–4 weeks.
4. Backend Systems
Learn:
- queues
- memory
- event workflows
Estimated: 3–5 weeks.
5. Agronomy Fundamentals
Learn:
- crop physiology
- nutrient management
- production systems
Estimated: ongoing.
Suggested Database Design
Users
↓
Organizations
↓
Farms
↓
Fields
↓
Crop Cycles
↓
Observations
↓
Conversations
↓
Recommendations
↓
Knowledge Base
↓
Reports
How To Build It (MVP Plan)
Phase 1 — Validation MVP (45–60 Days)
Build:
✔ Login
✔ Farm profile
✔ AI chat
✔ Recommendation history
✔ Crop timeline
Launch.
Do not build:
✘ Fine-tuning
✘ Multi-agent AI
✘ Sensors
✘ Autonomous planning
Start with strong context.
Phase 2 — Intelligence Layer
Add:
- memory
- recommendations
- alerting
Phase 3 — Continuous Agronomist
Add:
- forecasting
- automatic planning
- anomaly detection
Cost-Effective Way To Build
Lean AI Stack
- Frontend: Flutter
- Backend: Supabase
- Database: PostgreSQL + pgvector
- AI: API usage
- Hosting: Cloudflare
- Monitoring: PostHog
- Estimated MVP Cost: $300–$1,500
- Estimated Build Time: 60–120 days
Do not train models first.
Win through workflow.
Monetization
Free
- limited consultations
Pro
- unlimited advisory
Enterprise
- cooperatives and agribusinesses
Additional Revenue:
- agronomy marketplace
- analytics subscriptions
- expert review services
Competitive Advantage Strategy
Do not build an agricultural chatbot.
Build an agronomist.
A chatbot answers questions.
An agronomist remembers what happened last month and changes recommendations because of it.
That difference creates long-term retention.
App #10 — Agricultural Supply Chain Visibility Platform
The Agritech App That Tracks Agricultural Products From Farm to Customer.
Why This App Opportunity Exists
Agriculture does not end at harvest.
That is where complexity begins.
Typical agricultural flow:
Input Supplier
↓
Farm
↓
Harvest
↓
Storage
↓
Transport
↓
Processing
↓
Distribution
↓
Customer
At every stage:
- delays happen
- inventory changes
- quality shifts
- records break
One missing record can create:
- lost revenue
- rejected exports
- compliance problems
- customer disputes
This app solves visibility.
What This App Is
A platform that tracks agricultural products across the supply chain and helps users understand movement, quality, inventory, and operational status.
Users manage:
- inputs
- harvests
- storage
- transport
- processing
- deliveries
The system provides:
- traceability
- inventory intelligence
- shipment visibility
- quality monitoring
- reporting
Think: Supply Chain OS × Traceability × Agricultural Operations.
Core Features
1. Batch Tracking System
Assign every production unit:
Batch
↓
Lot
↓
Shipment
Example:
Harvest Batch: TM2026-001
Track movement across stages.
This becomes the foundation.
2. Chain-of-Custody Tracking
Track:
Who handled product
↓
When
↓
Where
↓
What changed
Useful for:
- food safety
- export readiness
- quality audits
3. Inventory Intelligence
Show:
Available
↓
Reserved
↓
In Transit
↓
Delivered
Users instantly know stock position.
4. Quality Monitoring
Record:
- temperature
- quality checks
- inspection results
- spoilage
Generate:
Quality score.
5. Shipment Visibility
Monitor:
Dispatch
↓
Transit
↓
Arrival
↓
Exceptions
Notify users about delays.
6. Procurement Management
Track:
- supplier performance
- purchase history
- fulfillment
7. Supply Chain Dashboard
Display:
Inventory
↓
Movement
↓
Losses
↓
Lead Times
↓
Fulfillment Rate
Executives love this screen.
8. Recall Management
If contamination occurs:
Find:
Affected batches
↓
Locations
↓
Customers
This feature becomes extremely valuable.
How The App Functions
Production
↓
Batch Creation
↓
Inventory
↓
Movement Tracking
↓
Quality Events
↓
Delivery
↓
Analytics
↓
Reporting
Recommended Architecture
- Frontend: Flutter
- Backend: Supabase
- Database: PostgreSQL
- Realtime: Supabase Realtime
- Storage: Cloud Storage
- Maps: Mapbox
- Queue: Background Jobs
- Notifications: Firebase
- Analytics: PostHog
- Hosting: Cloudflare
Recommended System Modules
Identity
↓
Inventory
↓
Tracking
↓
Quality
↓
Reporting
↓
Analytics
↓
Alerts
Build modules independently.
Suggested Traceability Model
Entity
↓
Batch
↓
Event
↓
Location
↓
Actor
↓
Status
↓
Timeline
Simple.
Scalable.
Required Knowledge And Skills
1. Supply Chain Fundamentals
Learn:
- inventory
- fulfillment
- logistics
- traceability
Estimated: 3–5 weeks.
2. Flutter Enterprise Development
Learn:
- dashboards
- scanning
- workflow UI
Estimated: 3 weeks.
3. Backend System Design
Learn:
- event sourcing
- real-time architecture
Estimated: 4–6 weeks.
4. Database Modeling
Learn:
- audit trails
- state transitions
Estimated: 2–4 weeks.
5. Reporting Systems
Learn:
- operational analytics
- exports
- KPIs
Estimated: 2 weeks.
Optional Expansion Technologies
QR Codes
↓
Barcode Scanning
↓
IoT Sensors
↓
Cold Chain Monitoring
↓
Digital Compliance
Do not start with these.
Earn complexity.
Suggested Database Design
Organizations
↓
Users
↓
Suppliers
↓
Products
↓
Batches
↓
Inventory
↓
Locations
↓
Shipments
↓
Quality Events
↓
Reports
Example KPIs To Track
Inventory Accuracy
↓
Loss Rate
↓
Order Fill Rate
↓
Average Lead Time
↓
Spoilage %
↓
Delivery Reliability
↓
Traceability Coverage
How To Build It (MVP Plan)
Phase 1 — Validation MVP (45–60 Days)
Build:
✔ Login
✔ Batch tracking
✔ Inventory
✔ Shipment logs
✔ Dashboard
Launch.
Do not build:
✘ Blockchain
✘ IoT
✘ Compliance automation
✘ Predictive logistics
Version one should prove operational value.
Phase 2 — Visibility Layer
Add:
- quality workflows
- alerts
- supplier analytics
Phase 3 — Intelligence Platform
Add:
- forecasting
- optimization
- anomaly detection
Cost-Effective Way To Build
Practical Startup Stack
- Frontend: Flutter
- Backend: Supabase
- Database: PostgreSQL
- Maps: Mapbox
- Hosting: Cloudflare
- Notifications: Firebase
- Estimated MVP Cost: $300–$1,500
- Estimated Build Time: 60–120 days
Avoid overengineering.
Traceability first.
Monetization
Free
- limited inventory
Professional
- operational analytics
Enterprise
- multi-site management
Additional Revenue:
- supplier intelligence
- audit reporting
- compliance services
Competitive Advantage Strategy
Most agritech products focus on production.
Build software for what happens after production.
The further a product travels, the more valuable visibility becomes.
Visibility reduces uncertainty.
Reduced uncertainty creates trust.
Trust creates revenue.
App #11 — Livestock Health Early Warning App
The Agritech App That Detects Problems Before Farmers Notice Them.
Why This App Opportunity Exists
Most livestock operations are reactive.
Problem appears.
↓
Farmer notices.
↓
Diagnosis begins.
↓
Action happens.
But biology starts changing long before visible symptoms appear.
Examples:
Feed consumption drops.
Movement changes.
Body temperature shifts.
Water intake changes.
Growth slows.
Animals isolate.
Stress increases.
These signals often appear before obvious disease.
That creates your opportunity.
Build software that identifies abnormal patterns early.
What This App Is
A livestock monitoring and intelligence platform that helps farmers detect health risks before they become expensive.
Users monitor:
- animal groups
- feeding
- movement
- growth
- environment
- treatment history
The system produces:
- health alerts
- abnormality detection
- recommendations
- trend reports
- operational insights
Think: Animal Intelligence × Monitoring × Decision Support.
Core Features
1. Animal Profile Engine
Create records for:
- species
- breed
- age
- weight
- housing
- treatment history
Support:
Individual animals
or
Grouped management.
2. Health Monitoring Dashboard
Track:
- feed intake
- water intake
- growth
- mortality
- environment
Outputs:
Health score.
3. Early Warning Detection
Detect patterns such as:
Feed ↓
Movement ↓
Temperature ↑
Weight gain ↓
Generate:
Early alerts.
This becomes your core value.
4. Observation Logging
Workers record:
- symptoms
- photos
- notes
- incidents
System builds historical intelligence.
5. Treatment Planner
Track:
Issue
↓
Action
↓
Follow-up
↓
Outcome
Useful for continuous improvement.
6. Environmental Monitoring
Monitor:
- temperature
- humidity
- ventilation
- stocking conditions
Especially valuable for:
- poultry
- greenhouse livestock
- indoor systems
7. Growth Performance Analytics
Show:
Expected Growth
↓
Actual Growth
↓
Deviation
Managers immediately see issues.
8. Risk Alert Engine
Notify users:
- abnormal mortality
- poor growth
- stress indicators
- unusual patterns
How The App Functions
Animal Records
Observations
Environment
Sensor Data (optional)
↓
Monitoring Layer
↓
Health Engine
↓
Risk Detection
↓
Recommendations
↓
Dashboard
Recommended Architecture
- Frontend: Flutter
- Backend: Supabase
- Database: PostgreSQL
- Realtime: Supabase Realtime
- Storage: Cloud Storage
- AI: Inference Services
- Analytics: PostHog
- Notifications: Firebase
- Hosting: Cloudflare
Recommended Intelligence Layers
Layer 1
Record Collection
↓
Layer 2
Health Rules
↓
Layer 3
Pattern Detection
↓
Layer 4
Prediction
↓
Layer 5
Recommendations
Do not jump directly into AI.
Rules create strong MVPs.
Optional Sensor Expansion
Add later:
Feed Sensors
↓
Water Sensors
↓
Temperature Sensors
↓
Weight Systems
↓
Cameras
↓
Environmental Sensors
Build software first.
Required Knowledge And Skills
1. Flutter Cross-Platform Systems
Learn:
- dashboards
- offline sync
- notifications
Estimated: 2–3 weeks.
2. Livestock Production Basics
Learn:
- growth stages
- health indicators
- production systems
Estimated: ongoing.
3. Event-Based Backend Design
Learn:
- monitoring systems
- event processing
Estimated: 3–5 weeks.
4. Analytics Engineering
Learn:
- anomaly detection
- KPI tracking
Estimated: 3–5 weeks.
5. Computer Vision (Later Stage)
Learn:
- object tracking
- image analysis
- behavioral detection
Estimated: 6–10 weeks.
Suggested Database Design
Organizations
↓
Users
↓
Farms
↓
Animal Groups
↓
Observations
↓
Health Events
↓
Feed Records
↓
Environment Records
↓
Alerts
↓
Reports
Example KPIs To Track
Mortality Rate
↓
Feed Conversion
↓
Average Daily Gain
↓
Growth Efficiency
↓
Health Score
↓
Water Consumption
↓
Alert Frequency
These KPIs become product stickiness.
How To Build It (MVP Plan)
Phase 1 — Validation MVP (45–60 Days)
Build:
✔ Login
✔ Animal records
✔ Observation logs
✔ Dashboard
✔ Alerts
Launch.
Do not build:
✘ Sensors
✘ Computer vision
✘ Prediction models
✘ Automation
Version one should help users notice problems earlier.
Phase 2 — Intelligence Layer
Add:
- trend analysis
- health scoring
- recommendations
Phase 3 — Predictive Platform
Add:
- anomaly detection
- computer vision
- automated monitoring
Cost-Effective Way To Build
Lean Monitoring Stack
- Frontend: Flutter
- Backend: Supabase
- Database: PostgreSQL
- Hosting: Cloudflare
- Notifications: Firebase
- Estimated MVP Cost: $200–$1,000
- Estimated Build Time: 60–90 days
If adding hardware prototypes:
- Add: $100–$400
for experimentation.
Monetization
Free
- limited animals
Professional
- monitoring tools
Enterprise
- multi-site operations
Additional Revenue:
- analytics subscriptions
- consulting
- livestock benchmarking
Competitive Advantage Strategy
Most livestock software records what already happened.
Build software that warns before problems become visible.
The earlier users detect problems, the more valuable your product becomes.
Prevention compounds.
Losses compound too.
App #12 — Soil Restoration Recommendation Engine
The Agritech App That Helps Farmers Rebuild Soil and Recover Productivity.
Why This App Opportunity Exists
Many farmers notice symptoms:
- Lower yield.
- Higher fertilizer bills.
- Poor water retention.
- Uneven growth.
- More disease pressure.
But symptoms are often treated while causes remain.
One of the biggest hidden causes:
- Declining soil performance.
Today, soil decisions are often based on:
- assumptions
- generic fertilizer schedules
- historical habits
- occasional lab reports
What people need is:
Continuous soil decision support.
That creates your opportunity.
Build software that helps users restore soil systematically.
Not emotionally.
Not generically.
What This App Is
A recommendation platform that helps users improve soil condition through personalized restoration plans.
Users provide:
- soil information
- crop history
- management history
- environmental conditions
- observations
- optional lab data
The system produces:
- restoration recommendations
- nutrient guidance
- improvement timelines
- intervention priorities
- economic impact projections
Think: Soil Consultant × Restoration Planner × Intelligence Engine.
Core Features
1. Soil Health Assessment
Collect:
- soil texture
- pH
- drainage
- organic matter
- production history
Generate:
Soil health score.
This becomes the foundation.
2. Restoration Recommendation Engine
Recommend actions such as:
- cover cropping
- organic amendments
- nutrient balancing
- crop rotation
- water management
Present:
Priority order.
3. Nutrient Recovery Planner
Estimate:
Current condition
↓
Target condition
↓
Recovery path
Show users realistic progress.
4. Soil Observation Journal
Track:
- photos
- notes
- field observations
- changes over time
Create historical context.
5. Economic Impact Simulator
Estimate:
Investment
↓
Recovery timeline
↓
Expected benefits
Very powerful for adoption.
6. Multi-Season Planning
Show:
Season 1
↓
Season 2
↓
Season 3
↓
Long-term outcomes
Restoration is not instant.
7. Soil Trend Dashboard
Visualize:
- soil score
- improvement
- risk indicators
- intervention impact
8. Risk Alert Engine
Notify users:
- degradation risk
- imbalance
- excessive dependency
- declining indicators
How The App Functions
Field Inputs
Historical Records
Soil Data
Observations
↓
Analysis Layer
↓
Recommendation Engine
↓
Economic Model
↓
Planning Layer
↓
Dashboard
Recommended Architecture
- Frontend: Flutter
- Backend: Supabase
- Database: PostgreSQL
- Storage: Cloud Storage
- Analytics: PostHog
- Notifications: Firebase
- Hosting: Cloudflare
- Reporting: PDF exports
Recommended Intelligence Layers
Layer 1
Data Collection
↓
Layer 2
Rules Engine
↓
Layer 3
Scoring
↓
Layer 4
Recommendations
↓
Layer 5
Planning
Start rules-first.
AI later.
Data Inputs To Support
Manual Inputs
↓
Historical Production
↓
Field Records
↓
Optional Lab Results
↓
Observations
↓
Environmental Factors
Do not require laboratory integration initially.
Required Knowledge And Skills
1. Agricultural Soil Fundamentals
Learn:
- soil structure
- nutrient cycles
- soil indicators
Estimated: 4–6 weeks.
2. Recommendation Systems
Learn:
- scoring logic
- decision trees
- prioritization
Estimated: 2–4 weeks.
3. Flutter Dashboard Development
Learn:
- forms
- reporting
- progress tracking
Estimated: 2–3 weeks.
4. Backend Engineering
Learn:
- workflow systems
- historical tracking
Estimated: 3–5 weeks.
5. Agricultural Economics
Learn:
- cost-benefit analysis
- intervention economics
Estimated: ongoing.
Suggested Database Design
Users
↓
Organizations
↓
Farms
↓
Fields
↓
Soil Profiles
↓
Observations
↓
Recommendations
↓
Plans
↓
Reports
↓
Progress Logs
Example Soil KPIs
Soil Health Score
↓
Organic Matter Trend
↓
Water Efficiency
↓
Nutrient Balance
↓
Intervention Success
↓
Yield Recovery
↓
Cost Efficiency
These metrics become your retention engine.
How To Build It (MVP Plan)
Phase 1 — Validation MVP (45–60 Days)
Build:
✔ Login
✔ Soil assessment
✔ Recommendations
✔ Progress tracking
✔ Dashboard
Launch.
Do not build:
✘ Laboratory integrations
✘ Sensors
✘ Machine learning
✘ Satellite imagery
Version one should create clear action plans.
Phase 2 — Intelligence Layer
Add:
- scoring refinement
- forecasting
- economic analysis
Phase 3 — Restoration Platform
Add:
- AI recommendations
- advanced planning
- field benchmarking
Cost-Effective Way To Build
Lean Recommendation Stack
- Frontend: Flutter
- Backend: Supabase
- Database: PostgreSQL
- Hosting: Cloudflare
- Reporting: PDF exports
- Estimated MVP Cost: $150–$800
- Estimated Build Time: 45–75 days
Keep recommendations explainable.
Users trust visible logic.
Monetization
Free
- limited assessments
Professional
- advanced planning
Enterprise
- multi-field management
Additional Revenue:
- consulting
- benchmarking
- restoration reporting
Competitive Advantage Strategy
Most agricultural software optimizes production.
Build software that improves the system that creates production.
Healthier soil improves almost everything downstream:
- yield
- cost
- resilience
- profitability
- long-term sustainability
That makes this category larger than it first appears.
App #13 — Agricultural Loan Readiness App
The Agritech App That Helps Farmers Become Finance-Ready Before They Apply.
Why This App Opportunity Exists
Many agricultural operators believe financing starts when an application is submitted.
It starts much earlier.
Capital providers usually evaluate questions like:
- Can this operation repay?
- Is the business organized?
- Are assumptions realistic?
- Is there operating history?
- Are risks understood?
- Is there evidence?
Many applicants arrive with:
Photos
↓
Ideas
↓
Optimism
Instead of:
Records
↓
Projections
↓
Business readiness
That gap creates your opportunity.
Build software that turns agricultural operators into investment-ready businesses.
What This App Is
A financial preparation and credit-readiness platform built specifically for agriculture.
Users prepare:
- business profiles
- financial records
- production plans
- projections
- documentation
The system generates:
- readiness scores
- improvement plans
- application packages
- funding insights
Think: Financial Coach × Business Builder × Agricultural Readiness Engine.
Core Features
1. Funding Readiness Assessment
Evaluate:
- records
- planning
- cash flow
- operating structure
- financial consistency
Generate:
Funding readiness score.
Example:
Readiness: 68%
Critical Gaps: 3
Next Actions: 5
2. Agricultural Profile Builder
Collect:
- farm details
- production history
- operational metrics
- investment goals
Create:
Standardized business profiles.
3. Financial Documentation Engine
Organize:
- expenses
- revenue
- assets
- projections
Generate:
Structured documentation.
4. Projection Generator
Estimate:
Revenue
↓
Costs
↓
Cash Flow
↓
Repayment Capacity
Users stop guessing.
5. Risk Preparedness Module
Assess:
- weather exposure
- market concentration
- operating risk
- dependency risks
Generate mitigation plans.
6. Funding Package Generator
Create:
Application-ready exports.
Include:
- summaries
- assumptions
- forecasts
- supporting records
7. Capital Matching Layer (Later Stage)
Suggest:
Potential financing categories based on readiness.
Do not start here.
Build preparation first.
8. Progress Dashboard
Show:
Current readiness
↓
Completed requirements
↓
Remaining actions
↓
Timeline
This drives user engagement.
How The App Functions
Business Inputs
Financial Data
Operational Records
↓
Readiness Engine
↓
Scoring Layer
↓
Projection Engine
↓
Document Builder
↓
Dashboard
Recommended Architecture
- Frontend: Flutter
- Backend: Supabase
- Database: PostgreSQL
- Reporting: Server-side generation
- Storage: Cloud Storage
- Analytics: PostHog
- Notifications: Firebase
- Hosting: Cloudflare
Recommended Readiness Layers
Business Data
↓
Validation Rules
↓
Financial Models
↓
Readiness Scoring
↓
Recommendations
↓
Application Builder
Do not overcomplicate scoring.
Transparency builds trust.
Example Readiness Categories
Business Structure
↓
Production Records
↓
Cash Flow
↓
Financial Discipline
↓
Risk Controls
↓
Operational Capacity
↓
Growth Plan
Required Knowledge And Skills
1. Financial Analysis
Learn:
- cash flow
- debt capacity
- budgeting
Estimated: 4–6 weeks.
2. Agricultural Economics
Learn:
- farm financial structure
- operating models
Estimated: ongoing.
3. Flutter Product Development
Learn:
- forms
- workflows
- dashboards
Estimated: 2–3 weeks.
4. Backend Data Validation
Learn:
- scoring systems
- document pipelines
Estimated: 3–5 weeks.
5. Report Generation
Learn:
- structured exports
- automated reporting
Estimated: 2 weeks.
Suggested Database Design
Users
↓
Organizations
↓
Farms
↓
Financial Records
↓
Production Records
↓
Readiness Scores
↓
Action Plans
↓
Reports
↓
Documents
↓
Applications
Example KPIs To Track
Readiness Score
↓
Cash Stability
↓
Record Completeness
↓
Projection Accuracy
↓
Documentation Coverage
↓
Funding Progress
These KPIs become product value.
How To Build It (MVP Plan)
Phase 1 — Validation MVP (45–60 Days)
Build:
✔ Login
✔ Farm profile
✔ Readiness assessment
✔ Document uploads
✔ Report generation
Launch.
Do not build:
✘ Loan applications
✘ Banking integrations
✘ Credit scoring
✘ Automated approvals
Version one should improve preparation.
Phase 2 — Intelligence Layer
Add:
- recommendations
- forecasting
- readiness automation
Phase 3 — Financing Platform
Add:
- collaboration
- lender workflows
- financing ecosystems
Cost-Effective Way To Build
Lean Financial Platform Stack
- Frontend: Flutter
- Backend: Supabase
- Database: PostgreSQL
- Storage: Cloud Storage
- Reporting: PDF exports
- Hosting: Cloudflare
- Estimated MVP Cost: $200–$900
- Estimated Build Time: 45–75 days
Do not build lender integrations early.
Build trust and readiness first.
Monetization
Free
- basic readiness checks
Professional
- advanced reports
Enterprise
- cooperatives and advisory firms
Additional Revenue:
- application preparation
- premium reporting
- consulting services
Competitive Advantage Strategy
Most platforms try to connect users to money.
Build one that makes users worthy of money.
Prepared businesses attract capital.
Preparation compounds.
So does credibility.
App #14 — Smart Farm Construction Planner
The Agritech App That Helps Farmers Design Infrastructure Before Spending Money.
Why This App Opportunity Exists
Many farm projects fail long before operations begin.
Not because production was wrong.
Because infrastructure decisions were expensive.
Examples:
Greenhouse built in poor orientation.
↓
Water storage undersized.
↓
Road access ignored.
↓
Storage too far from production.
↓
Expansion impossible.
↓
Operating costs increase.
Agricultural infrastructure decisions compound.
Good layouts reduce cost for years.
Bad layouts create permanent inefficiency.
That is the opportunity.
What This App Is
A planning and simulation platform that helps users design agricultural infrastructure digitally before construction begins.
Users define:
- land dimensions
- farm type
- production goals
- budget
- infrastructure requirements
The system generates:
- layouts
- space allocation
- cost estimates
- construction phases
- efficiency recommendations
Think: Farm CAD × Business Planning × Infrastructure Intelligence.
Core Features
1. Digital Land Builder
User inputs:
- dimensions
- shape
- boundaries
- elevation assumptions
Create:
Digital farm canvas.
This becomes the foundation.
2. Infrastructure Layout Engine
Users place:
- greenhouses
- roads
- storage
- livestock units
- water systems
- processing zones
System tracks:
Space utilization.
3. Construction Cost Simulator
Estimate:
Land preparation
↓
Infrastructure
↓
Utilities
↓
Expansion
↓
Total cost
Show cost changes instantly.
4. Workflow Optimization Engine
Analyze:
Distance
↓
Movement
↓
Accessibility
↓
Efficiency
Recommend better layouts.
5. Phased Expansion Planner
Allow users to build:
Phase 1
↓
Phase 2
↓
Phase 3
↓
Final State
Very valuable for budget-conscious users.
6. Water And Utility Planner
Estimate:
- water routes
- storage
- electricity distribution
- pumping requirements
7. Construction Timeline Builder
Generate:
Tasks
↓
Dependencies
↓
Milestones
↓
Expected completion
8. Investment Impact Dashboard
Show:
Cost
↓
Capacity
↓
Efficiency
↓
Expansion readiness
How The App Functions
Farm Inputs
Layout Data
Infrastructure Rules
↓
Simulation Layer
↓
Cost Engine
↓
Optimization
↓
Visualization
↓
Reports
Recommended Architecture
- Frontend: Flutter
- Backend: Supabase
- Database: PostgreSQL
- Canvas Rendering: Flutter Custom Painter
- Maps: Mapbox
- Storage: Cloud Storage
- Analytics: PostHog
- Notifications: Firebase
- Hosting: Cloudflare
Recommended System Modules
Layout
↓
Simulation
↓
Cost Modeling
↓
Optimization
↓
Reporting
↓
Versioning
Build independently.
Suggested Planning Model
Land
↓
Zones
↓
Infrastructure
↓
Utilities
↓
Operations
↓
Expansion
↓
Reports
This structure scales well.
Recommended Rendering Approach
Stage 1
2D Builder
↓
Stage 2
Interactive Layout
↓
Stage 3
Lightweight 3D Views
Do not start with 3D.
2D wins early.
Required Knowledge And Skills
1. Flutter Advanced UI
Learn:
- canvas
- gestures
- rendering
Estimated: 4–6 weeks.
2. Geometry And Layout Systems
Learn:
- positioning
- constraints
- optimization
Estimated: 2–4 weeks.
3. Agricultural Infrastructure
Learn:
- greenhouse planning
- water systems
- logistics
Estimated: ongoing.
4. Backend Modeling
Learn:
- simulation architecture
- project storage
Estimated: 3–5 weeks.
5. Cost Modeling
Learn:
- construction estimates
- scenario analysis
Estimated: 2–4 weeks.
Suggested Database Design
Users
↓
Organizations
↓
Projects
↓
Land Units
↓
Layouts
↓
Infrastructure
↓
Utilities
↓
Cost Models
↓
Reports
↓
Versions
Example KPIs To Track
Land Utilization
↓
Cost Efficiency
↓
Expansion Capacity
↓
Road Efficiency
↓
Water Coverage
↓
Build Progress
↓
Infrastructure ROI
These become decision tools.
How To Build It (MVP Plan)
Phase 1 — Validation MVP (45–60 Days)
Build:
✔ Login
✔ Land builder
✔ Layout editor
✔ Cost calculator
✔ Report export
Launch.
Do not build:
✘ 3D rendering
✘ Satellite integration
✘ Drone mapping
✘ AI optimization
Version one should help users plan.
Phase 2 — Simulation Layer
Add:
- utility routing
- workflow analysis
- phased planning
Phase 3 — Intelligent Design Platform
Add:
- recommendations
- optimization
- automated layouts
Cost-Effective Way To Build
Lean Construction Stack
- Frontend: Flutter
- Backend: Supabase
- Database: PostgreSQL
- Canvas: Flutter rendering
- Hosting: Cloudflare
- Reporting: PDF exports
- Estimated MVP Cost: $300–$1,200
- Estimated Build Time: 60–100 days
Skip CAD complexity initially.
Build decision tools first.
Monetization
Free
- limited projects
Professional
- advanced planning
Enterprise
- consultants and developers
Additional Revenue:
- planning reports
- design services
- supplier partnerships
Competitive Advantage Strategy
Most farm software begins after construction.
Build software for decisions made before construction.
Infrastructure mistakes become expensive habits.
Good planning compounds for years.
App #15 — Greenhouse Climate Automation App
The Agritech App That Runs Greenhouse Conditions Intelligently.
Why This App Opportunity Exists
Greenhouses promise control.
But many operators still manage them manually.
Someone checks:
Temperature
↓
Humidity
↓
Ventilation
↓
Irrigation
↓
Lighting
↓
Makes adjustments
↓
Repeats
This creates problems:
- delayed reactions
- inconsistent conditions
- wasted labor
- energy inefficiency
- unstable yield
The future is not monitoring.
The future is coordinated control.
That is the opportunity.
What This App Is
A climate intelligence and automation platform that helps greenhouse operators monitor and control environmental conditions.
Users manage:
- temperature
- humidity
- airflow
- irrigation
- lighting
- environmental schedules
The system produces:
- automation
- recommendations
- alerts
- optimization reports
- environmental analytics
Think: Greenhouse OS × Climate Intelligence × Automation.
Core Features
1. Environmental Monitoring Dashboard
Track:
- temperature
- humidity
- CO₂
- light
- irrigation
- airflow
Display:
Live greenhouse conditions.
This becomes the command center.
2. Climate Rule Engine
Users define:
IF
Temperature > threshold
THEN
Activate ventilation.
OR
IF
Humidity < target
THEN
Adjust environment.
Rules reduce manual work.
3. Automation Scheduler
Configure:
Morning
↓
Midday
↓
Evening
↓
Night
Different environmental targets.
4. Climate Optimization Engine
Evaluate:
Current state
↓
Target state
↓
Recommended actions
Goal:
Stable growing conditions.
5. Alert System
Notify users:
- overheating
- excessive humidity
- environmental instability
- failed automation
6. Environmental History
Track:
Hours
↓
Days
↓
Weeks
↓
Seasons
Reveal patterns.
7. Energy Intelligence
Measure:
- electricity usage
- environmental cost
- efficiency trends
This becomes extremely valuable.
8. Multi-Greenhouse Control
Allow management of:
Greenhouse A
↓
Greenhouse B
↓
Greenhouse C
Single dashboard.
How The App Functions
Sensors
Environmental Rules
Schedules
↓
Control Layer
↓
Decision Engine
↓
Automation
↓
Monitoring
↓
Analytics
↓
Recommendations
Recommended Architecture
- Frontend: Flutter
- Backend: Supabase
- Database: PostgreSQL
- Realtime: Supabase Realtime
- IoT: MQTT
- Automation: Edge Functions
- Storage: Cloud Storage
- Analytics: PostHog
- Notifications: Firebase
- Hosting: Cloudflare
Recommended Hardware Stack (Later Stage)
Sensors
- temperature
- humidity
- CO₂
- light
↓
Controller
ESP32
↓
Gateway
Raspberry Pi
↓
Cloud
Backend Platform
Do not start here.
Start with simulation.
Recommended System Layers
Monitoring
↓
Rules
↓
Automation
↓
Control
↓
Analytics
↓
Optimization
Build independently.
Example Automation Rules
Rule 1
Temperature > 30°C
↓
Open ventilation
Rule 2
Humidity > 85%
↓
Increase airflow
Rule 3
Light < target
↓
Activate lighting
Keep rules transparent.
Required Knowledge And Skills
1. Flutter Realtime Systems
Learn:
- streaming UI
- dashboards
- event updates
Estimated: 3–4 weeks.
2. IoT Fundamentals
Learn:
- sensors
- device communication
- automation logic
Estimated: 4–6 weeks.
3. Controlled Environment Agriculture
Learn:
- climate variables
- greenhouse operation
Estimated: ongoing.
4. Backend Event Architecture
Learn:
- queues
- realtime processing
Estimated: 3–5 weeks.
5. Automation Design
Learn:
- rules engines
- scheduling
Estimated: 2–4 weeks.
Suggested Database Design
Organizations
↓
Users
↓
Greenhouses
↓
Devices
↓
Sensor Records
↓
Rules
↓
Automation Events
↓
Schedules
↓
Alerts
↓
Reports
Example KPIs To Track
Climate Stability
↓
Temperature Accuracy
↓
Humidity Control
↓
Automation Success
↓
Energy Efficiency
↓
Environmental Cost
↓
Yield Correlation
These become product differentiation.
How To Build It (MVP Plan)
Phase 1 — Validation MVP (45–60 Days)
Build:
✔ Login
✔ Greenhouse dashboard
✔ Manual controls
✔ Rule creation
✔ Alerts
Launch.
Do not build:
✘ Sensors
✘ Full automation
✘ AI optimization
✘ Predictive control
Version one should create visibility.
Phase 2 — Automation Layer
Add:
- scheduling
- environmental rules
- device control
Phase 3 — Autonomous Greenhouse
Add:
- optimization
- forecasting
- adaptive automation
Cost-Effective Way To Build
Lean Climate Stack
- Frontend: Flutter
- Backend: Supabase
- Realtime: Supabase
- Hosting: Cloudflare
- Notifications: Firebase
- Estimated MVP Cost: Software Only: $250–$900
- With Prototype Hardware: $400–$1,500
- Estimated Build Time: 60–120 days
Start with virtual devices.
Validate before buying hardware.
Monetization
Free
- one greenhouse
Professional
- automation features
Enterprise
- multi-site control
Additional Revenue:
- hardware bundles
- consulting
- environmental reporting
Competitive Advantage Strategy
Most greenhouse apps show conditions.
Build one that changes conditions.
Monitoring tells users what happened.
Automation changes what happens next.
App #16 — Post-Harvest Loss Prevention App
The Agritech App That Helps Farmers Protect Value After Harvest.
Why This App Opportunity Exists
Agricultural success is often measured at harvest.
But profitability is often decided afterward.
Typical flow:
Harvest
↓
Storage
↓
Sorting
↓
Transport
↓
Distribution
↓
Customer
At every stage:
- quality changes
- inventory ages
- losses accumulate
Common problems:
- Products harvested too early.
- Storage overloaded.
- Temperature ignored.
- Shipments delayed.
- No visibility into inventory age.
- Many operators discover losses only after revenue disappears.
That creates your opportunity.
Build software that helps users preserve value after harvest.
What This App Is
A post-harvest intelligence and workflow platform that helps agricultural operators reduce spoilage and improve product movement.
Users manage:
- harvested inventory
- storage conditions
- shelf life
- movement
- quality checks
The system provides:
- spoilage warnings
- inventory recommendations
- storage guidance
- operational analytics
Think: Inventory Intelligence × Shelf-Life Engine × Agricultural Operations.
Core Features
1. Harvest Intake System
Record:
- crop
- harvest date
- quantity
- grade
- location
Generate:
Digital inventory.
This becomes the foundation.
2. Shelf-Life Prediction Engine
Estimate:
Current age
↓
Expected remaining life
↓
Risk level
Example:
Fresh Tomato
Remaining window: 4 days
Priority: Move immediately
3. Storage Monitoring
Track:
- temperature
- humidity
- storage conditions
- occupancy
Generate:
Storage health score.
4. Inventory Rotation Engine
Recommend:
Sell first
↓
Store longer
↓
Reprocess
↓
Move immediately
This becomes extremely valuable.
5. Quality Inspection Workflow
Record:
- damage
- defects
- appearance
- grading
Generate:
Quality history.
6. Loss Tracking Dashboard
Measure:
- shrinkage
- spoilage
- rejected volume
- storage losses
Users finally see where money disappears.
7. Logistics Coordination
Track:
Pickup
↓
Storage
↓
Shipment
↓
Delivery
Reduce delays.
8. Alert Engine
Notify users:
- approaching expiry
- quality decline
- storage issues
- movement delays
How The App Functions
Harvest Data
Storage Records
Inventory Events
↓
Shelf-Life Engine
↓
Decision Layer
↓
Movement Planning
↓
Dashboard
↓
Alerts
Recommended Architecture
- Frontend: Flutter
- Backend: Supabase
- Database: PostgreSQL
- Realtime: Supabase Realtime
- Storage: Cloud Storage
- Notifications: Firebase
- Analytics: PostHog
- Hosting: Cloudflare
Recommended Intelligence Layers
Inventory
↓
Quality
↓
Storage
↓
Risk Detection
↓
Recommendations
↓
Reporting
Start with rules.
Prediction later.
Example Decision Rules
Rule 1
Storage Temperature ↑
↓
Spoilage Risk ↑
Rule 2
Inventory Age ↑
↓
Movement Priority ↑
Rule 3
Quality Score ↓
↓
Alert User
Keep recommendations explainable.
Required Knowledge And Skills
1. Flutter Operational Systems
Learn:
- inventory UI
- dashboards
- workflow management
Estimated: 3 weeks.
2. Post-Harvest Management
Learn:
- storage systems
- shelf life
- quality handling
Estimated: ongoing.
3. Backend Event Systems
Learn:
- inventory events
- lifecycle tracking
Estimated: 3–5 weeks.
4. Analytics Development
Learn:
- reporting
- KPIs
- operational intelligence
Estimated: 2–4 weeks.
5. Forecasting Logic
Learn:
- risk scoring
- prioritization
Estimated: 2–3 weeks.
Suggested Database Design
Organizations
↓
Users
↓
Harvest Records
↓
Inventory
↓
Storage Units
↓
Quality Checks
↓
Movement Logs
↓
Alerts
↓
Reports
↓
Analytics
Example KPIs To Track
Spoilage Rate
↓
Storage Utilization
↓
Inventory Age
↓
Quality Score
↓
Fulfillment Time
↓
Loss Reduction
↓
Recovery Value
These metrics become your product value.
How To Build It (MVP Plan)
Phase 1 — Validation MVP (45–60 Days)
Build:
✔ Login
✔ Harvest intake
✔ Inventory tracking
✔ Alerts
✔ Dashboard
Launch.
Do not build:
✘ Sensors
✘ Computer vision
✘ AI prediction
✘ Automation
Version one should reduce avoidable losses.
Phase 2 — Intelligence Layer
Add:
- shelf-life estimation
- quality scoring
- movement planning
Phase 3 — Preservation Platform
Add:
- prediction
- automation
- optimization
Cost-Effective Way To Build
Lean Operations Stack
- Frontend: Flutter
- Backend: Supabase
- Database: PostgreSQL
- Hosting: Cloudflare
- Notifications: Firebase
- Estimated MVP Cost: $150–$900
- Estimated Build Time: 45–90 days
Start with inventory logic.
Not hardware.
Monetization
Free
- limited inventory
Professional
- analytics and alerts
Enterprise
- multi-site management
Additional Revenue:
- reporting
- consulting
- operational insights
Competitive Advantage Strategy
Most agritech software helps users grow more.
Build software that helps users lose less.
Reducing losses often improves profit faster than increasing production.
Preserved value becomes income.
App #17 — Agricultural Export Readiness Platform
The Agritech App That Helps Agricultural Businesses Prepare for International Markets.
Why This App Opportunity Exists
Exporting agricultural products sounds simple.
Grow.
Pack.
Ship.
But actual export operations involve:
- documentation
- standards
- quality controls
- traceability
- timing
- operational discipline
Many businesses fail not because products are poor.
They fail because systems are incomplete.
Common problems:
- Missing records.
- Poor traceability.
- Incomplete workflows.
- Packaging issues.
- Documentation delays.
- No readiness assessment.
That creates your opportunity.
Build infrastructure that turns agricultural businesses into export-ready operations.
What This App Is
A readiness and operations platform that helps users evaluate and improve their ability to export agricultural products.
Users manage:
- production records
- quality processes
- documentation
- operational workflows
- shipment preparation
The system provides:
- readiness scoring
- gap analysis
- action plans
- export documentation
- compliance tracking
Think: Export Operations × Business Readiness × Agricultural Intelligence.
Core Features
1. Export Readiness Assessment
Evaluate:
- production systems
- quality controls
- documentation
- operational maturity
Generate:
Export readiness score.
Example:
Readiness: 72%
Critical Gaps: 4
Estimated Timeline: 90 days
This becomes the product entry point.
2. Documentation Management
Organize:
- farm records
- production records
- shipment records
- supporting documents
Create:
Centralized documentation.
3. Traceability Builder
Track:
Field
↓
Harvest
↓
Storage
↓
Shipment
↓
Customer
Build evidence.
4. Compliance Workflow Engine
Manage:
Tasks
↓
Reviews
↓
Approvals
↓
Status
Users see progress clearly.
5. Quality Management System
Track:
- inspections
- defects
- corrective actions
- quality history
Generate:
Quality performance metrics.
6. Shipment Preparation Planner
Manage:
Packaging
↓
Labeling
↓
Scheduling
↓
Shipment readiness
Reduce surprises.
7. Market Readiness Dashboard
Show:
Readiness
↓
Documentation
↓
Traceability
↓
Operational status
8. Improvement Roadmap
Generate:
Priority actions
↓
Timeline
↓
Progress
This increases retention.
How The App Functions
Operational Data
Documentation
Quality Records
↓
Assessment Engine
↓
Readiness Scoring
↓
Workflow Layer
↓
Reporting
↓
Dashboard
Recommended Architecture
- Frontend: Flutter
- Backend: Supabase
- Database: PostgreSQL
- Storage: Cloud Storage
- Reporting: Server-side generation
- Realtime: Supabase
- Analytics: PostHog
- Notifications: Firebase
- Hosting: Cloudflare
Recommended Platform Layers
Records
↓
Validation
↓
Scoring
↓
Documentation
↓
Workflow
↓
Reporting
Build modularly.
Example Readiness Categories
Documentation
↓
Traceability
↓
Operational Capacity
↓
Quality Systems
↓
Consistency
↓
Shipment Readiness
↓
Risk Management
Keep scoring understandable.
Required Knowledge And Skills
1. Workflow Product Design
Learn:
- approvals
- process management
- operational systems
Estimated: 3 weeks.
2. Agricultural Supply Chains
Learn:
- movement
- quality
- fulfillment
Estimated: ongoing.
3. Flutter Enterprise Development
Learn:
- forms
- dashboards
- document systems
Estimated: 3 weeks.
4. Backend Architecture
Learn:
- workflow orchestration
- status transitions
Estimated: 3–5 weeks.
5. Reporting Systems
Learn:
- exports
- audits
- traceability reports
Estimated: 2 weeks.
Suggested Database Design
Organizations
↓
Users
↓
Farms
↓
Products
↓
Quality Records
↓
Documents
↓
Traceability Events
↓
Shipments
↓
Readiness Scores
↓
Reports
Example KPIs To Track
Readiness Score
↓
Documentation Coverage
↓
Shipment Success
↓
Quality Performance
↓
Process Completion
↓
Export Cycle Time
↓
Issue Resolution
These become business metrics.
How To Build It (MVP Plan)
Phase 1 — Validation MVP (45–60 Days)
Build:
✔ Login
✔ Readiness assessment
✔ Document storage
✔ Traceability
✔ Dashboard
Launch.
Do not build:
✘ International integrations
✘ Compliance automation
✘ Market matching
✘ AI recommendations
Version one should improve preparedness.
Phase 2 — Operations Layer
Add:
- workflows
- quality management
- reporting
Phase 3 — Export Platform
Add:
- intelligent guidance
- collaboration
- ecosystem integrations
Cost-Effective Way To Build
Lean Export Stack
- Frontend: Flutter
- Backend: Supabase
- Database: PostgreSQL
- Storage: Cloud Storage
- Reporting: PDF exports
- Hosting: Cloudflare
- Estimated MVP Cost: $250–$1,000
- Estimated Build Time: 60–90 days
Do not build marketplaces first.
Build operational trust.
Monetization
Free
- basic readiness tools
Professional
- workflow and reporting
Enterprise
- multi-team operations
Additional Revenue:
- documentation services
- readiness audits
- consulting subscriptions
Competitive Advantage Strategy
Most businesses search for export buyers too early.
Build software that helps them become export-ready first.
Prepared operations scale faster.
Trust opens markets.
Systems create trust.
App #18 — AI Farm Cost Optimization App
The Agritech App That Continuously Finds Ways to Reduce Farm Costs.
Why This App Opportunity Exists
Agricultural businesses operate under pressure.
- Input costs rise.
- Labor changes.
- Energy becomes expensive.
- Margins tighten.
Most operators react by cutting spending everywhere.
That often creates new problems.
Reduce fertilizer.
↓
Yield drops.
Reduce labor.
↓
Operations slow.
Reduce irrigation.
↓
Production suffers.
The better approach:
Optimize.
Not blindly reduce.
That is the opportunity.
Build software that continuously identifies better cost decisions.
What This App Is
An intelligence platform that analyzes farm operations and recommends actions that improve efficiency.
Users connect:
- expenses
- production
- labor
- inventory
- utilities
- operational records
The system produces:
- cost insights
- recommendations
- savings opportunities
- forecasts
- performance benchmarks
Think: Financial Intelligence × Operational Analytics × Recommendation Engine.
Core Features
1. Cost Visibility Dashboard
Show:
Total Cost
↓
Cost Breakdown
↓
Trend
↓
Efficiency Score
Users immediately see where money goes.
2. Expense Intelligence Engine
Categorize:
- labor
- inputs
- utilities
- maintenance
- logistics
Generate:
Cost patterns.
3. Optimization Recommendation Engine
Recommend actions:
Reduce irrigation schedule.
↓
Combine deliveries.
↓
Adjust labor allocation.
↓
Change operational timing.
Recommendations should explain impact.
4. Cost Benchmarking
Compare:
Current Farm
↓
Historical Performance
↓
Internal Targets
Help users understand context.
5. Profit Impact Simulator
Show:
Current State
↓
Recommended Change
↓
Expected Result
Example:
Reduce fuel route inefficiency
Expected savings: 12%
6. Forecasting Module
Estimate Upcoming:
- expenses
- pressure points
- operational risks
Prepare users early.
7. Opportunity Feed
Continuously surface:
Top cost-saving actions.
This can become your most-used feature.
8. Alert Engine
Notify users:
- unusual spending
- margin decline
- inefficient operations
- cost anomalies
How The App Functions
Transactions
Production Records
Operations
↓
Cost Engine
↓
Analytics
↓
Optimization
↓
Recommendation Layer
↓
Dashboard
Recommended Architecture
- Frontend: Flutter
- Backend: Supabase
- Database: PostgreSQL
- Caching: Redis
- Analytics: PostHog
- Storage: Cloud Storage
- Notifications: Firebase
- Hosting: Cloudflare
- AI: Recommendation Services
Recommended Intelligence Layers
Operational Data
↓
Normalization
↓
Cost Analysis
↓
Pattern Detection
↓
Recommendation
↓
Reporting
Start with explainable logic.
Example Optimization Rules
Rule 1
Labor Cost ↑
↓
Investigate productivity
Rule 2
Input Cost ↑
↓
Compare alternatives
Rule 3
Utility Cost ↑
↓
Recommend efficiency actions
Avoid black-box outputs.
Recommended Recommendation Categories
Labor
↓
Water
↓
Energy
↓
Inputs
↓
Logistics
↓
Inventory
↓
Scheduling
Keep categories visible.
Required Knowledge And Skills
1. Financial Analytics
Learn:
- cost accounting
- KPI analysis
- margin management
Estimated: 4–6 weeks.
2. Recommendation Systems
Learn:
- scoring
- prioritization
- explainability
Estimated: 3–5 weeks.
3. Flutter Data Products
Learn:
- dashboards
- analytics UI
- reporting
Estimated: 3 weeks.
4. Backend Computation
Learn:
- pipelines
- processing
- optimization logic
Estimated: 3–5 weeks.
5. Agricultural Economics
Learn:
- production economics
- operational efficiency
Estimated: ongoing.
Suggested Database Design
Organizations
↓
Users
↓
Transactions
↓
Production Records
↓
Costs
↓
Recommendations
↓
Forecasts
↓
Alerts
↓
Reports
↓
Benchmarks
Example KPIs To Track
Cost Per Unit
↓
Labor Efficiency
↓
Input Efficiency
↓
Energy Cost
↓
Margin Trend
↓
Savings Generated
↓
Optimization Score
These metrics become retention drivers.
How To Build It (MVP Plan)
Phase 1 — Validation MVP (45–60 Days)
Build:
✔ Login
✔ Expense tracking
✔ Dashboard
✔ Recommendations
✔ Reports
Launch.
Do not build:
✘ AI forecasting
✘ ERP integrations
✘ autonomous optimization
✘ predictive simulation
Version one should produce understandable savings.
Phase 2 — Intelligence Layer
Add:
- forecasting
- benchmarking
- advanced analytics
Phase 3 — Optimization Platform
Add:
- adaptive recommendations
- automated workflows
- decision automation
Cost-Effective Way To Build
Lean Optimization Stack
- Frontend: Flutter
- Backend: Supabase
- Database: PostgreSQL
- Caching: Redis
- Hosting: Cloudflare
- Charts: fl_chart
- Estimated MVP Cost: $250–$1,000
- Estimated Build Time: 60–90 days
Do not build AI first.
Good recommendations outperform complex AI.
Monetization
Free
- basic analytics
Professional
- recommendations
Enterprise
- multi-operation optimization
Additional Revenue:
- benchmarking
- advisory services
- executive reporting
Competitive Advantage Strategy
Most agricultural software tells users where money went.
Build software that tells users what to do next.
Visibility explains the past.
Optimization changes the future.
App #19 — Agritech Equipment Sharing Marketplace
The Agritech App That Helps Agricultural Businesses Share, Rent, and Utilize Equipment Better.
Why This App Opportunity Exists
Agricultural equipment is expensive.
Examples:
- tractors
- harvesters
- planters
- sprayers
- processing machines
- irrigation systems
- cold storage assets
Many operators face this problem:
Buy equipment
↓
Use briefly
↓
Leave idle
Idle assets destroy capital efficiency.
At the same time:
Smaller operators cannot justify ownership.
This creates an enormous opportunity.
Build software that improves equipment access.
What This App Is
A marketplace and operational platform that allows agricultural users to discover, reserve, rent, manage, and optimize equipment utilization.
Users can:
- list equipment
- search equipment
- schedule bookings
- manage usage
- track operations
The system provides:
- discovery
- availability
- scheduling
- payments
- analytics
Think: Equipment Network × Booking Platform × Agricultural Operations.
Core Features
1. Equipment Listing System
Owners create listings:
- equipment type
- availability
- location
- pricing
- specifications
Create searchable inventory.
This becomes supply.
2. Discovery Engine
Users search by:
- category
- availability
- distance
- capacity
Return best matches.
Focus on speed.
3. Scheduling And Booking
Workflow:
Search
↓
Reserve
↓
Approve
↓
Use
↓
Complete
Avoid double-booking.
4. Availability Calendar
Display:
Booked
↓
Available
↓
Maintenance
↓
Unavailable
This becomes highly used.
5. Usage Tracking
Record:
- operating time
- utilization
- assignments
- history
Useful for owners.
6. Trust And Verification Layer
Track:
- completion history
- reliability
- operational records
Trust drives transactions.
7. Payment Workflow
Manage:
Reservation
↓
Payment
↓
Completion
↓
Settlement
Start simple.
8. Marketplace Analytics
Show:
Revenue
↓
Utilization
↓
Demand
↓
Availability
How The App Functions
Equipment Listings
Availability
Booking Requests
↓
Matching Layer
↓
Scheduling
↓
Usage Tracking
↓
Settlement
↓
Analytics
Recommended Architecture
- Frontend: Flutter
- Backend: Supabase
- Database: PostgreSQL
- Realtime: Supabase Realtime
- Maps: Mapbox
- Storage: Cloud Storage
- Notifications: Firebase
- Analytics: PostHog
- Hosting: Cloudflare
Recommended Marketplace Layers
Supply
↓
Discovery
↓
Matching
↓
Booking
↓
Settlement
↓
Analytics
Build independently.
Suggested Booking Model
Equipment
↓
Availability
↓
Reservation
↓
Approval
↓
Usage
↓
Completion
↓
Review
Simple.
Scalable.
Example Marketplace Categories
Field Equipment
↓
Irrigation
↓
Harvest Equipment
↓
Processing Equipment
↓
Storage Assets
↓
Transport Assets
Keep categories clear.
Required Knowledge And Skills
1. Marketplace Product Design
Learn:
- discovery
- matching
- scheduling
Estimated: 3–5 weeks.
2. Flutter Full-Platform Development
Learn:
- maps
- calendars
- booking flows
Estimated: 3 weeks.
3. Backend Marketplace Systems
Learn:
- availability
- transactions
- concurrency
Estimated: 4–6 weeks.
4. Operational Analytics
Learn:
- marketplace metrics
- utilization analysis
Estimated: 2–4 weeks.
5. Trust Infrastructure
Learn:
- reviews
- dispute workflows
- verification
Estimated: ongoing.
Suggested Database Design
Users
↓
Organizations
↓
Equipment
↓
Availability
↓
Bookings
↓
Usage Records
↓
Payments
↓
Reviews
↓
Reports
↓
Analytics
Example KPIs To Track
Utilization Rate
↓
Booking Success
↓
Revenue Per Asset
↓
Time Idle
↓
Completion Rate
↓
Repeat Usage
↓
Marketplace Liquidity
These become your growth metrics.
How To Build It (MVP Plan)
Phase 1 — Validation MVP (45–60 Days)
Build:
✔ Login
✔ Equipment listings
✔ Search
✔ Booking
✔ Dashboard
Launch.
Do not build:
✘ Dynamic pricing
✘ Insurance
✘ IoT tracking
✘ complex settlement
Version one should prove demand.
Phase 2 — Marketplace Layer
Add:
- reviews
- payments
- analytics
Phase 3 — Equipment Network
Add:
- optimization
- recommendations
- advanced matching
Cost-Effective Way To Build
Lean Marketplace Stack
- Frontend: Flutter
- Backend: Supabase
- Database: PostgreSQL
- Maps: Mapbox
- Hosting: Cloudflare
- Notifications: Firebase
- Estimated MVP Cost: $300–$1,500
- Estimated Build Time: 60–100 days
Avoid logistics complexity initially.
Solve discovery first.
Monetization
Free
- basic listings
Professional
- advanced visibility
Enterprise
- fleet management
Additional Revenue:
- booking fees
- subscriptions
- analytics
Competitive Advantage Strategy
Most farms think in ownership.
Build software that improves access.
Higher utilization creates value.
Idle assets become productive assets.
App #20 — Agricultural Workforce Management Platform
The Agritech App That Helps Agricultural Businesses Coordinate and Improve Labor Operations.
Why This App Opportunity Exists
Agriculture is operationally intensive.
Even with mechanization, people remain critical.
Workers influence:
- planting
- irrigation
- harvesting
- logistics
- maintenance
- quality
But many operations have limited visibility.
Typical problems:
Task duplication.
↓
Poor coordination.
↓
Low accountability.
↓
Attendance issues.
↓
Productivity uncertainty.
↓
Higher costs.
That creates your opportunity.
Build software that turns agricultural labor into measurable operations.
What This App Is
A workforce operations and productivity platform built specifically for agricultural environments.
Users manage:
- workers
- attendance
- assignments
- productivity
- schedules
- operational performance
The system provides:
- workforce visibility
- task coordination
- performance analytics
- labor insights
- operational reporting
Think: Workforce OS × Operations × Productivity Intelligence.
Core Features
1. Worker Management System
Create profiles:
- role
- skill level
- availability
- assignments
- work history
This becomes workforce memory.
2. Attendance And Check-In
Support:
Clock In
↓
Work Session
↓
Clock Out
Track:
- time
- location
- shifts
Keep implementation practical.
3. Task Assignment Engine
Managers assign:
Task
↓
Team
↓
Location
↓
Deadline
Track completion.
4. Productivity Dashboard
Show:
Completed Tasks
↓
Hours Worked
↓
Output
↓
Efficiency
This becomes management’s home screen.
5. Scheduling System
Plan:
Daily
↓
Weekly
↓
Seasonal
Avoid labor conflicts.
6. Workforce Analytics
Measure:
- utilization
- attendance
- output
- performance trends
Visibility changes behavior.
7. Operational Communication
Enable:
Updates
↓
Announcements
↓
Status
↓
Field coordination
Reduce dependency on messaging apps.
8. Alert Engine
Notify users:
- absences
- delays
- missed targets
- low productivity
How The App Functions
Workers
Schedules
Tasks
↓
Assignment Engine
↓
Execution
↓
Tracking
↓
Analytics
↓
Dashboard
Recommended Architecture
- Frontend: Flutter
- Backend: Supabase
- Database: PostgreSQL
- Realtime: Supabase Realtime
- Storage: Cloud Storage
- Notifications: Firebase
- Analytics: PostHog
- Hosting: Cloudflare
Recommended Workforce Layers
Identity
↓
Scheduling
↓
Execution
↓
Tracking
↓
Analytics
↓
Reporting
Build independently.
Example Workforce Workflows
Manager
↓
Create Tasks
↓
Assign Workers
↓
Track Progress
↓
Approve Completion
↓
Generate Reports
Simple workflows scale.
Optional Expansion Features
Add later:
QR Check-In
↓
Biometric Attendance
↓
Geo Validation
↓
Voice Logging
↓
Wearables
Do not start here.
Required Knowledge And Skills
1. Workflow Product Design
Learn:
- scheduling
- assignments
- operational UX
Estimated: 2–4 weeks.
2. Flutter Enterprise Development
Learn:
- forms
- realtime UI
- dashboards
Estimated: 3 weeks.
3. Backend Event Systems
Learn:
- assignments
- notifications
- analytics
Estimated: 3–5 weeks.
4. Analytics Engineering
Learn:
- KPIs
- workforce metrics
Estimated: 2–4 weeks.
5. Operations Management
Learn:
- labor efficiency
- process coordination
Estimated: ongoing.
Suggested Database Design
Organizations
↓
Users
↓
Workers
↓
Schedules
↓
Assignments
↓
Attendance
↓
Task Records
↓
Reports
↓
Alerts
↓
Analytics
Example KPIs To Track
Attendance Rate
↓
Task Completion
↓
Labor Utilization
↓
Output Per Worker
↓
Overtime Rate
↓
Schedule Accuracy
↓
Productivity Trend
These become retention drivers.
How To Build It (MVP Plan)
Phase 1 — Validation MVP (45–60 Days)
Build:
✔ Login
✔ Worker profiles
✔ Attendance
✔ Task assignment
✔ Dashboard
Launch.
Do not build:
✘ Payroll
✘ Biometrics
✘ AI scheduling
✘ automation
Version one should improve coordination.
Phase 2 — Intelligence Layer
Add:
- analytics
- alerts
- scheduling improvements
Phase 3 — Workforce Platform
Add:
- optimization
- forecasting
- advanced coordination
Cost-Effective Way To Build
Lean Workforce Stack
- Frontend: Flutter
- Backend: Supabase
- Database: PostgreSQL
- Realtime: Supabase
- Hosting: Cloudflare
- Notifications: Firebase
- Estimated MVP Cost: $250–$900
- Estimated Build Time: 45–75 days
Start with attendance and assignments.
Avoid payroll complexity.
Monetization
Free
- limited workers
Professional
- analytics and scheduling
Enterprise
- multi-location operations
Additional Revenue:
- consulting
- benchmarking
- workforce reporting
Competitive Advantage Strategy
Most workforce tools measure attendance.
Build software that improves outcomes.
Labor is not just a cost.
It is a production system.
Better coordination increases output without increasing headcount.
App #21 — Agribusiness Market Intelligence Platform
The Agritech App That Helps Agricultural Businesses Make Better Market Decisions.
Why This App Opportunity Exists
Agriculture is often treated as a production problem.
But profitability is frequently determined by market timing.
Two farms can produce identical outputs.
One earns more.
Why?
Better decisions.
Examples:
Planted earlier.
↓
Sold into stronger demand.
↓
Avoided oversupply.
↓
Negotiated better.
↓
Reduced timing mistakes.
Many agricultural businesses lack:
- demand visibility
- pricing intelligence
- market forecasting
- buyer insights
That creates your opportunity.
Build software that helps users decide what, when, where, and how to sell.
What This App Is
A market intelligence and decision platform designed for agricultural operators.
Users monitor:
- prices
- demand
- buyer signals
- product trends
- regional movement
- opportunities
The system provides:
- market insights
- recommendations
- forecasts
- alerts
- planning support
Think: Bloomberg Terminal × Agricultural Analytics × Decision Intelligence.
Core Features
1. Price Intelligence Dashboard
Display:
Current Prices
↓
Historical Trends
↓
Price Changes
↓
Opportunity Signals
Users quickly understand market movement.
2. Demand Monitoring Engine
Track:
- buyer demand
- seasonal movement
- emerging interest
Generate:
Demand scores.
3. Opportunity Discovery Feed
Recommend:
Products
↓
Regions
↓
Timing
↓
Categories
Users receive actionable ideas.
4. Buyer Intelligence Layer
Show:
- purchase activity
- buying patterns
- market signals
Keep it practical.
5. Market Forecasting
Estimate:
Short-Term
↓
Medium-Term
↓
Long-Term
Focus on probabilities.
6. Production Planning Assistant
Recommend:
Plant
↓
Expand
↓
Reduce
↓
Delay
Connect market intelligence to production.
7. Alert Engine
Notify users:
- price movement
- demand shifts
- unusual opportunities
- market volatility
8. Decision Dashboard
Display:
Market Score
↓
Demand Index
↓
Risk Indicators
↓
Suggested Actions
How The App Functions
Market Inputs
Historical Records
Price Signals
Operational Context
↓
Aggregation Layer
↓
Analysis
↓
Forecasting
↓
Recommendations
↓
Dashboard
Recommended Architecture
- Frontend: Flutter
- Backend: Supabase
- Database: PostgreSQL
- Caching: Redis
- Analytics: PostHog
- Storage: Cloud Storage
- Notifications: Firebase
- Hosting: Cloudflare
- Data Pipeline: Background Jobs
Recommended Intelligence Layers
Collection
↓
Normalization
↓
Aggregation
↓
Analysis
↓
Forecasting
↓
Recommendations
Start with clean data.
Example Market Decision Rules
Rule 1
Demand ↑
Price ↑
↓
Increase attention
Rule 2
Supply ↑
Price ↓
↓
Increase caution
Rule 3
Volatility ↑
↓
Reduce confidence score
Keep signals explainable.
Example Data Sources (Later Stage)
User Reports
↓
Market Feeds
↓
Transaction History
↓
Regional Inputs
↓
Operational Records
Avoid dependence on one source.
Required Knowledge And Skills
1. Analytics Engineering
Learn:
- aggregation
- trend analysis
- forecasting
Estimated: 4–6 weeks.
2. Flutter Data Products
Learn:
- charts
- dashboards
- filtering
Estimated: 3 weeks.
3. Backend Pipelines
Learn:
- ingestion
- processing
- caching
Estimated: 4–6 weeks.
4. Recommendation Systems
Learn:
- scoring
- ranking
- prioritization
Estimated: 3–5 weeks.
5. Agricultural Economics
Learn:
- demand
- pricing
- market behavior
Estimated: ongoing.
Suggested Database Design
Organizations
↓
Users
↓
Markets
↓
Products
↓
Price Records
↓
Demand Signals
↓
Recommendations
↓
Forecasts
↓
Alerts
↓
Reports
Example KPIs To Track
Price Accuracy
↓
Demand Confidence
↓
Forecast Reliability
↓
Decision Adoption
↓
Market Opportunity Score
↓
Revenue Impact
↓
Retention
These become your product engine.
How To Build It (MVP Plan)
Phase 1 — Validation MVP (45–60 Days)
Build:
✔ Market dashboard
✔ Price tracking
✔ Alerts
✔ Recommendations
✔ Reports
Launch.
Do not build:
✘ AI prediction
✘ automated trading
✘ marketplace
✘ advanced optimization
Version one should improve decisions.
Phase 2 — Intelligence Layer
Add:
- forecasting
- buyer insights
- advanced analytics
Phase 3 — Strategic Platform
Add:
- simulations
- optimization
- planning workflows
Cost-Effective Way To Build
Lean Intelligence Stack
- Frontend: Flutter
- Backend: Supabase
- Database: PostgreSQL
- Caching: Redis
- Hosting: Cloudflare
- Charts: fl_chart
- Estimated MVP Cost: $250–$1,200
- Estimated Build Time: 60–100 days
Data quality beats model complexity.
Monetization
Free
- limited market tracking
Professional
- forecasting and analytics
Enterprise
- team intelligence
Additional Revenue:
- premium datasets
- consulting
- benchmarking
Competitive Advantage Strategy
Most agricultural tools help users produce better.
Build software that helps users decide better.
Better production increases supply.
Better decisions increase profit.
App #22 — Agricultural Input Recommendation Platform
The Agritech App That Helps Agricultural Businesses Choose Better Inputs and Improve Returns.
Why This App Opportunity Exists
Input decisions shape almost everything downstream.
Wrong decisions create:
Higher cost
↓
Lower efficiency
↓
Yield instability
↓
Margin pressure
↓
Reduced confidence
Many operators still choose inputs based on:
- habit
- marketing claims
- local assumptions
- incomplete comparisons
This creates unnecessary variability.
That creates your opportunity.
Build software that helps users choose inputs systematically.
What This App Is
An agricultural recommendation and planning platform that helps users select inputs using contextual data and expected outcomes.
Users provide:
- crop
- production goals
- field conditions
- historical performance
- budget
- constraints
The system produces:
- recommendations
- alternatives
- expected outcomes
- planning guidance
- optimization insights
Think: Input Intelligence × Decision Support × Agronomic Planning.
Core Features
1. Input Decision Dashboard
Display:
Current Inputs
↓
Expected Performance
↓
Alternatives
↓
Confidence Score
Users quickly compare options.
2. Recommendation Engine
Evaluate:
Crop
Conditions
Goals
↓
Recommended Inputs
Explain reasoning.
3. Alternative Comparison System
Compare:
Option A
↓
Option B
↓
Option C
Show tradeoffs.
Users trust transparency.
4. Budget Optimization Module
Estimate:
Input Cost
↓
Expected Impact
↓
Efficiency
Help users spend intentionally.
5. Seasonal Planning Tool
Plan:
Pre-Season
↓
Growth
↓
Maintenance
↓
Harvest
Coordinate inputs over time.
6. Historical Performance Layer
Track:
Previous Inputs
↓
Results
↓
Lessons
Build institutional memory.
7. Recommendation Feedback Loop
Collect:
Recommended
↓
Applied
↓
Outcome
↓
Improve Suggestions
This becomes a moat.
8. Alert Engine
Notify users:
- unusual input spending
- timing issues
- missed opportunities
- planning conflicts
How The App Functions
Farm Context
Historical Records
Production Goals
Input Catalog
↓
Recommendation Engine
↓
Scenario Analysis
↓
Planning
↓
Dashboard
↓
Insights
Recommended Architecture
- Frontend: Flutter
- Backend: Supabase
- Database: PostgreSQL
- Storage: Cloud Storage
- Analytics: PostHog
- Caching: Redis
- Notifications: Firebase
- Hosting: Cloudflare
Recommended Decision Layers
Context
↓
Rules
↓
Scoring
↓
Ranking
↓
Recommendations
↓
Feedback
Start simple.
Complexity can come later.
Example Recommendation Logic
Rule 1
Budget ↓
↓
Recommend efficient alternatives
Rule 2
Performance Priority ↑
↓
Weight output more heavily
Rule 3
Risk Tolerance ↓
↓
Favor stable options
Keep logic visible.
Example Recommendation Categories
Seeds
↓
Nutrition
↓
Water Inputs
↓
Crop Protection
↓
Growing Media
↓
Operational Inputs
Do not overwhelm users.
Required Knowledge And Skills
1. Recommendation Systems
Learn:
- scoring
- ranking
- optimization
Estimated: 3–5 weeks.
2. Flutter Decision Products
Learn:
- comparisons
- forms
- dashboards
Estimated: 3 weeks.
3. Backend Modeling
Learn:
- rule engines
- evaluation workflows
Estimated: 3–5 weeks.
4. Agricultural Fundamentals
Learn:
- production systems
- input categories
- operational decisions
Estimated: ongoing.
5. Product Analytics
Learn:
- experimentation
- measurement
- outcome tracking
Estimated: 2–3 weeks.
Suggested Database Design
Organizations
↓
Users
↓
Farms
↓
Fields
↓
Input Catalog
↓
Recommendations
↓
Applications
↓
Outcomes
↓
Reports
↓
Analytics
Example KPIs To Track
Recommendation Adoption
↓
Cost Efficiency
↓
Input ROI
↓
Yield Improvement
↓
Budget Accuracy
↓
User Retention
↓
Outcome Confidence
These metrics become product differentiation.
How To Build It (MVP Plan)
Phase 1 — Validation MVP (45–60 Days)
Build:
✔ Login
✔ Farm profile
✔ Recommendation engine
✔ Input comparisons
✔ Dashboard
Launch.
Do not build:
✘ AI optimization
✘ external integrations
✘ automated purchasing
✘ advanced forecasting
Version one should improve decisions.
Phase 2 — Intelligence Layer
Add:
- personalization
- historical learning
- planning workflows
Phase 3 — Optimization Platform
Add:
- adaptive recommendations
- simulations
- decision automation
Cost-Effective Way To Build
Lean Recommendation Stack
- Frontend: Flutter
- Backend: Supabase
- Database: PostgreSQL
- Caching: Redis
- Hosting: Cloudflare
- Charts: fl_chart
- Estimated MVP Cost: $200–$900
- Estimated Build Time: 45–90 days
Win with recommendation quality.
Not feature quantity.
Monetization
Free
- limited recommendations
Professional
- advanced planning
Enterprise
- multi-farm management
Additional Revenue:
- analytics
- advisory subscriptions
- premium intelligence
Competitive Advantage Strategy
Most agricultural platforms show available inputs.
Build software that helps users decide which inputs deserve their money.
Inputs create outcomes.
Better decisions create better inputs.
App #22 — Agricultural Input Recommendation Platform
The Agritech App That Helps Agricultural Businesses Choose Better Inputs and Improve Returns.
Why This App Opportunity Exists
Input decisions shape almost everything downstream.
Wrong decisions create:
Higher cost
↓
Lower efficiency
↓
Yield instability
↓
Margin pressure
↓
Reduced confidence
Many operators still choose inputs based on:
- habit
- marketing claims
- local assumptions
- incomplete comparisons
This creates unnecessary variability.
That creates your opportunity.
Build software that helps users choose inputs systematically.
What This App Is
An agricultural recommendation and planning platform that helps users select inputs using contextual data and expected outcomes.
Users provide:
- crop
- production goals
- field conditions
- historical performance
- budget
- constraints
The system produces:
- recommendations
- alternatives
- expected outcomes
- planning guidance
- optimization insights
Think: Input Intelligence × Decision Support × Agronomic Planning.
Core Features
1. Input Decision Dashboard
Display:
Current Inputs
↓
Expected Performance
↓
Alternatives
↓
Confidence Score
Users quickly compare options.
2. Recommendation Engine
Evaluate:
Crop
Conditions
Goals
↓
Recommended Inputs
Explain reasoning.
3. Alternative Comparison System
Compare:
Option A
↓
Option B
↓
Option C
Show tradeoffs.
Users trust transparency.
4. Budget Optimization Module
Estimate:
Input Cost
↓
Expected Impact
↓
Efficiency
Help users spend intentionally.
5. Seasonal Planning Tool
Plan:
Pre-Season
↓
Growth
↓
Maintenance
↓
Harvest
Coordinate inputs over time.
6. Historical Performance Layer
Track:
Previous Inputs
↓
Results
↓
Lessons
Build institutional memory.
7. Recommendation Feedback Loop
Collect:
Recommended
↓
Applied
↓
Outcome
↓
Improve Suggestions
This becomes a moat.
8. Alert Engine
Notify users:
- unusual input spending
- timing issues
- missed opportunities
- planning conflicts
How The App Functions
Farm Context
Historical Records
Production Goals
Input Catalog
↓
Recommendation Engine
↓
Scenario Analysis
↓
Planning
↓
Dashboard
↓
Insights
Recommended Architecture
- Frontend: Flutter
- Backend: Supabase
- Database: PostgreSQL
- Storage: Cloud Storage
- Analytics: PostHog
- Caching: Redis
- Notifications: Firebase
- Hosting: Cloudflare
Recommended Decision Layers
Context
↓
Rules
↓
Scoring
↓
Ranking
↓
Recommendations
↓
Feedback
Start simple.
Complexity can come later.
Example Recommendation Logic
Rule 1
Budget ↓
↓
Recommend efficient alternatives
Rule 2
Performance Priority ↑
↓
Weight output more heavily
Rule 3
Risk Tolerance ↓
↓
Favor stable options
Keep logic visible.
Example Recommendation Categories
Seeds
↓
Nutrition
↓
Water Inputs
↓
Crop Protection
↓
Growing Media
↓
Operational Inputs
Do not overwhelm users.
Required Knowledge And Skills
1. Recommendation Systems
Learn:
- scoring
- ranking
- optimization
Estimated: 3–5 weeks.
2. Flutter Decision Products
Learn:
- comparisons
- forms
- dashboards
Estimated: 3 weeks.
3. Backend Modeling
Learn:
- rule engines
- evaluation workflows
Estimated: 3–5 weeks.
4. Agricultural Fundamentals
Learn:
- production systems
- input categories
- operational decisions
Estimated: ongoing.
5. Product Analytics
Learn:
- experimentation
- measurement
- outcome tracking
Estimated: 2–3 weeks.
Suggested Database Design
Organizations
↓
Users
↓
Farms
↓
Fields
↓
Input Catalog
↓
Recommendations
↓
Applications
↓
Outcomes
↓
Reports
↓
Analytics
Example KPIs To Track
Recommendation Adoption
↓
Cost Efficiency
↓
Input ROI
↓
Yield Improvement
↓
Budget Accuracy
↓
User Retention
↓
Outcome Confidence
These metrics become product differentiation.
How To Build It (MVP Plan)
Phase 1 — Validation MVP (45–60 Days)
Build:
✔ Login
✔ Farm profile
✔ Recommendation engine
✔ Input comparisons
✔ Dashboard
Launch.
Do not build:
✘ AI optimization
✘ external integrations
✘ automated purchasing
✘ advanced forecasting
Version one should improve decisions.
Phase 2 — Intelligence Layer
Add:
- personalization
- historical learning
- planning workflows
Phase 3 — Optimization Platform
Add:
- adaptive recommendations
- simulations
- decision automation
Cost-Effective Way To Build
Lean Recommendation Stack
- Frontend: Flutter
- Backend: Supabase
- Database: PostgreSQL
- Caching: Redis
- Hosting: Cloudflare
- Charts: fl_chart
- Estimated MVP Cost: $200–$900
- Estimated Build Time: 45–90 days
Win with recommendation quality.
Not feature quantity.
Monetization
Free
- limited recommendations
Professional
- advanced planning
Enterprise
- multi-farm management
Additional Revenue:
- analytics
- advisory subscriptions
- premium intelligence
Competitive Advantage Strategy
Most agricultural platforms show available inputs.
Build software that helps users decide which inputs deserve their money.
Inputs create outcomes.
Better decisions create better inputs.
App #23 — Agricultural Knowledge Graph Platform
The Agritech App That Connects Agricultural Information Into Explainable Intelligence.
Why This App Opportunity Exists
Agriculture produces connected events.
Nothing happens alone.
Examples:
Weather affects soil.
↓
Soil affects nutrition.
↓
Nutrition affects growth.
↓
Growth affects yield.
↓
Yield affects revenue.
But most software stores records separately.
Users get:
tables
↓
charts
↓
reports
Without understanding relationships.
That creates your opportunity.
Build software that connects agricultural knowledge.
What This App Is
A connected intelligence platform that models agricultural entities and their relationships.
Users connect:
- farms
- fields
- crops
- operations
- observations
- outcomes
The system produces:
- connected insights
- explainable recommendations
- root-cause analysis
- relationship discovery
- organizational memory
Think: Agricultural Brain × Graph Intelligence × Decision Support.
What Is A Knowledge Graph?
Traditional Database:
Field
→ Crop
→ Yield
Knowledge Graph:
Field
↔ Crop
↔ Irrigation
↔ Weather
↔ Inputs
↔ Disease
↔ Yield
Everything becomes connected.
Questions become easier.
Core Features
1. Agricultural Entity Engine
Create connected entities:
Farm
↓
Field
↓
Crop
↓
Activity
↓
Outcome
Everything becomes linkable.
2. Relationship Mapping
Track relationships:
Applied Fertilizer
↓
Changed Growth
↓
Affected Yield
↓
Changed Profit
Users finally understand causation paths.
3. Explainable Insight Engine
Instead of:
Yield ↓
Show:
Yield ↓
because:
Disease Risk ↑
AND
Water Stress ↑
AND
Late Intervention
Explainability becomes trust.
4. Query System
Allow users to ask:
- “What affected tomato profitability?”
- “What caused lower output?”
- “What changed compared to last season?”
Very powerful.
5. Decision Memory
Store:
Decision
↓
Action
↓
Outcome
↓
Lesson
This becomes institutional intelligence.
6. Recommendation Layer
Generate:
Recommendations using connected context.
Not isolated records.
7. Knowledge Explorer
Visualize:
Entities
↓
Relationships
↓
Dependencies
Users discover patterns.
8. Continuous Learning Layer
New records update relationships.
The system becomes smarter.
How The App Functions
Records
Events
Relationships
↓
Knowledge Graph
↓
Reasoning
↓
Insights
↓
Recommendations
↓
Dashboard
Recommended Architecture
- Frontend: Flutter
- Backend: Supabase
- Operational Database: PostgreSQL
- Graph Database: Neo4j
- Storage: Cloud Storage
- Analytics: PostHog
- Caching: Redis
- Notifications: Firebase
- Hosting: Cloudflare
Recommended Intelligence Layers
Collection
↓
Normalization
↓
Relationship Modeling
↓
Knowledge Graph
↓
Reasoning
↓
Insights
↓
Recommendations
This architecture scales.
Example Relationship Structure
Farm
↓
Field
↓
Crop
↓
Irrigation
↓
Growth
↓
Harvest
↓
Revenue
Every node should connect.
Example Graph Queries
Which fields had:
High Yield
AND
Low Input Cost?
Which activities increased:
Disease Risk?
Which decisions improved:
Profitability?
These become product magic.
Required Knowledge And Skills
1. Graph Database Design
Learn:
- nodes
- relationships
- graph queries
Estimated: 4–6 weeks.
2. Backend Architecture
Learn:
- event modeling
- data pipelines
Estimated: 4–6 weeks.
3. Flutter Visualization
Learn:
- graph UI
- interactive dashboards
Estimated: 3–5 weeks.
4. Recommendation Systems
Learn:
- reasoning
- explainability
Estimated: 3–5 weeks.
5. Agricultural Systems Thinking
Learn:
- dependencies
- agricultural interactions
Estimated: ongoing.
Suggested Database Design
Users
↓
Organizations
↓
Entities
↓
Relationships
↓
Events
↓
Insights
↓
Recommendations
↓
Reports
↓
History
↓
Analytics
Graph becomes the source of intelligence.
Example KPIs To Track
Relationship Coverage
↓
Insight Accuracy
↓
Recommendation Adoption
↓
Decision Confidence
↓
Knowledge Growth
↓
Query Success
↓
Retention
These metrics become product defensibility.
Example Graph Schema
Farm
→ owns → Field
Field
→ grows → Crop
Crop
→ affected_by → Weather
Weather
→ changes → Yield
Yield
→ influences → Revenue
Simple.
Expandable.
How To Build It (MVP Plan)
Phase 1 — Validation MVP (60–90 Days)
Build:
✔ Farm entities
✔ Relationship engine
✔ Query interface
✔ Insight dashboard
✔ Reports
Launch.
Do not build:
✘ AI agents
✘ autonomous reasoning
✘ massive ontologies
✘ distributed graphs
Version one should connect decisions.
Phase 2 — Intelligence Layer
Add:
- recommendations
- root-cause analysis
- advanced relationships
Phase 3 — Agricultural Brain
Add:
- explainable AI
- adaptive reasoning
- organization memory
Cost-Effective Way To Build
Lean Graph Stack
- Frontend: Flutter
- Backend: Supabase
- Graph: Neo4j Community
- Hosting: Cloudflare
- Caching: Redis
- Estimated MVP Cost: $300–$1,500
- Estimated Build Time: 75–120 days
Keep the graph small initially.
Connections matter more than scale.
Monetization
Free
- limited graph storage
Professional
- advanced insights
Enterprise
- organizational intelligence
Additional Revenue:
- analytics
- advisory tools
- knowledge services
Competitive Advantage Strategy
Most agricultural software stores information.
Build software that understands information.
Data tells users what happened.
Knowledge explains why it happened.
That difference becomes difficult to copy.
App #24 — Farm Digital Twin Platform
The Agritech App That Creates a Virtual Farm for Simulation and Decision Testing.
Why This App Opportunity Exists
Agricultural decisions are expensive.
Every decision changes outcomes.
Examples:
Change irrigation.
↓
Yield changes.
Change planting density.
↓
Disease risk changes.
Change labor.
↓
Operational speed changes.
Change harvest timing.
↓
Revenue changes.
Many operators discover outcomes after implementation.
That creates delays and losses.
The opportunity:
Create a virtual environment where decisions can be tested before execution.
What This App Is
A simulation and decision platform that creates a digital representation of agricultural operations.
Users model:
- farms
- fields
- production systems
- infrastructure
- costs
- operational assumptions
The system produces:
- simulations
- forecasts
- scenario comparisons
- operational insights
- decision guidance
Think: Flight Simulator × Farm Intelligence × Scenario Planning.
What Is A Digital Twin?
Physical Farm
↓
Digital Representation
↓
Continuous Updates
↓
Simulation
↓
Insights
↓
Better Decisions
The twin becomes a virtual decision environment.
Core Features
1. Farm Model Builder
Users define:
- land
- production structure
- infrastructure
- resources
- constraints
Create:
Digital farm profile.
This becomes the foundation.
2. Scenario Simulation Engine
Test:
Scenario A
↓
Scenario B
↓
Scenario C
Examples:
Increase irrigation.
Expand production.
Reduce labor.
Compare outcomes.
3. Forecast Dashboard
Estimate:
Production
↓
Cost
↓
Revenue
↓
Operational impact
Forecast visually.
4. Decision Comparison System
Display:
Current Plan
↓
Alternative
↓
Expected Difference
Users understand tradeoffs.
5. Timeline Simulation
Run:
Week
↓
Month
↓
Season
↓
Year
Observe outcomes over time.
6. Constraint Modeling
Model limits:
- budget
- labor
- water
- infrastructure
Simulation becomes realistic.
7. Risk Engine
Estimate:
Operational Risk
↓
Financial Risk
↓
Execution Risk
↓
Sensitivity
Very powerful.
8. Experiment Workspace
Allow users to create:
Test
↓
Run
↓
Compare
↓
Save
Users build institutional knowledge.
How The App Functions
Farm Data
Operational Inputs
Assumptions
↓
Model Layer
↓
Simulation Engine
↓
Forecasting
↓
Scenario Comparison
↓
Insights
↓
Dashboard
Recommended Architecture
- Frontend: Flutter
- Backend: Supabase
- Operational Database: PostgreSQL
- Simulation Engine: Dedicated Compute Services
- Caching: Redis
- Storage: Cloud Storage
- Analytics: PostHog
- Notifications: Firebase
- Hosting: Cloudflare
Recommended Platform Layers
Inputs
↓
Modeling
↓
Simulation
↓
Forecasting
↓
Comparison
↓
Recommendations
Build independently.
Example Simulation Rules
Rule 1
Labor ↓
↓
Task Delay ↑
Rule 2
Water ↓
↓
Yield Probability ↓
Rule 3
Input Cost ↑
↓
Profit ↓
Keep assumptions visible.
Example Simulation Dimensions
Production
↓
Infrastructure
↓
Operations
↓
Finance
↓
Expansion
↓
Risk
Avoid excessive variables initially.
Required Knowledge And Skills
1. Simulation Systems
Learn:
- modeling
- assumptions
- scenario analysis
Estimated: 4–8 weeks.
2. Flutter Advanced Products
Learn:
- dashboards
- visualization
- interactions
Estimated: 3–5 weeks.
3. Backend Computation
Learn:
- asynchronous jobs
- simulation execution
Estimated: 4–6 weeks.
4. Forecasting Fundamentals
Learn:
- estimation
- uncertainty
- confidence
Estimated: 3–5 weeks.
5. Agricultural Operations
Learn:
- production systems
- constraints
- economics
Estimated: ongoing.
Suggested Database Design
Organizations
↓
Users
↓
Farm Models
↓
Fields
↓
Scenarios
↓
Simulation Runs
↓
Forecasts
↓
Constraints
↓
Reports
↓
Insights
Example KPIs To Track
Simulation Accuracy
↓
Scenario Adoption
↓
Forecast Confidence
↓
Decision Improvement
↓
Operational Efficiency
↓
Risk Reduction
↓
User Retention
These become your defensibility.
Example Simulation Workflow
Create Model
↓
Select Variables
↓
Run Scenario
↓
Compare Outputs
↓
Save Decisions
↓
Implement
Simple workflow.
High value.
How To Build It (MVP Plan)
Phase 1 — Validation MVP (60–90 Days)
Build:
✔ Farm model
✔ Scenario editor
✔ Forecast dashboard
✔ Comparisons
✔ Reports
Launch.
Do not build:
✘ real-time twins
✘ AI agents
✘ IoT integrations
✘ autonomous decisions
Version one should help users think.
Phase 2 — Intelligence Layer
Add:
- forecasting
- sensitivity analysis
- recommendations
Phase 3 — Dynamic Digital Twin
Add:
- continuous updates
- adaptive simulation
- optimization
Cost-Effective Way To Build
Lean Simulation Stack
- Frontend: Flutter
- Backend: Supabase
- Database: PostgreSQL
- Compute: Background Jobs
- Hosting: Cloudflare
- Caching: Redis
- Estimated MVP Cost: $400–$1,800
- Estimated Build Time: 75–120 days
Build assumptions first.
Not physics.
Monetization
Free
- limited scenarios
Professional
- forecasting
Enterprise
- multi-operation planning
Additional Revenue:
- consulting
- benchmarking
- strategic planning
Competitive Advantage Strategy
Most farm software records reality.
Build software that creates alternative realities.
People pay for prediction.
But they stay for decision confidence.
App #25 — Agritech Operating System (AgriOS)
The Unified Platform That Runs Agricultural Operations End-to-End.
Why This App Opportunity Exists
Agriculture is becoming software-driven.
But software remains fragmented.
Operators switch between:
- communication tools
- spreadsheets
- inventory systems
- planning software
- analytics dashboards
- operational records
This creates:
duplicate work
↓
poor visibility
↓
decision delays
↓
higher cost
↓
reduced execution quality
The future is not more apps.
The future is fewer systems.
That is the opportunity.
Build the operating system for agricultural businesses.
What This App Is
An integrated agricultural platform that becomes the primary workspace for managing agricultural operations.
Users manage:
- production
- finance
- inventory
- labor
- equipment
- planning
- analytics
- reporting
The system becomes:
The central source of truth.
Think: ERP × Farm OS × Agritech Platform × Operational Intelligence.
Core Principles Of AgriOS
One Login
↓
One Workspace
↓
One Data Layer
↓
Many Capabilities
↓
Unified Decisions
This principle prevents fragmentation.
Core Features
1. Unified Dashboard
Display:
Operations
↓
Performance
↓
Tasks
↓
Risks
↓
Insights
Users should understand the business instantly.
2. Modular App Marketplace
Enable modules:
Production
↓
Inventory
↓
Workforce
↓
Equipment
↓
Finance
↓
Analytics
Users install only what they need.
This becomes your platform engine.
3. Central Data Layer
Every action writes into:
One shared system.
Example:
Harvest Completed
↓
Inventory Updated
↓
Finance Updated
↓
Analytics Updated
↓
Reports Updated
Single event.
Multiple outcomes.
4. Workflow Engine
Coordinate:
Tasks
↓
Approvals
↓
Execution
↓
Completion
↓
Reporting
Operations become structured.
5. Decision Intelligence Layer
Generate:
Insights
↓
Recommendations
↓
Alerts
↓
Forecasts
Help users act faster.
6. Cross-Module Search
Allow:
Search once.
Find everything.
Examples:
Field
↓
Worker
↓
Equipment
↓
Reports
↓
Costs
This becomes addictive.
7. Role-Based Workspace
Different experiences for:
Owners
↓
Managers
↓
Operators
↓
Analysts
↓
Executives
8. Operational Timeline
Display:
Events
↓
Changes
↓
History
↓
Decisions
↓
Outcomes
Create business memory.
How The App Functions
Users
Modules
Shared Data
↓
Workflow Layer
↓
Operations Engine
↓
Intelligence Layer
↓
Dashboard
↓
Reports
Recommended Architecture
- Frontend: Flutter
- Web: Flutter Web
- Backend: Supabase
- Database: PostgreSQL
- Caching: Redis
- Storage: Cloud Storage
- Analytics: PostHog
- Realtime: Supabase Realtime
- Notifications: Firebase
- Hosting: Cloudflare
- Queue: Background Workers
Recommended Platform Layers
Identity
↓
Organizations
↓
Permissions
↓
Modules
↓
Workflows
↓
Analytics
↓
Integrations
↓
Marketplace
Build layer by layer.
Suggested Module Sequence
Phase 1
Operations
↓
Phase 2
Inventory
↓
Phase 3
Workforce
↓
Phase 4
Analytics
↓
Phase 5
Marketplace
Do not build everything at once.
Example Data Flow
Worker Completed Harvest
↓
Inventory Updated
↓
Yield Calculated
↓
Revenue Estimated
↓
Dashboard Updated
↓
Alert Triggered
That is operating system behavior.
Required Knowledge And Skills
1. System Architecture
Learn:
- modular systems
- boundaries
- platform design
Estimated: 6–10 weeks.
2. Flutter At Scale
Learn:
- feature modules
- routing
- architecture
Estimated: 4–6 weeks.
3. Backend Platform Engineering
Learn:
- APIs
- orchestration
- event systems
Estimated: 6–8 weeks.
4. Database Architecture
Learn:
- multi-tenancy
- shared services
- scaling
Estimated: 4–6 weeks.
5. Product Strategy
Learn:
- ecosystems
- adoption
- retention
Estimated: ongoing.
Suggested Database Design
Organizations
↓
Users
↓
Permissions
↓
Modules
↓
Events
↓
Workflows
↓
Analytics
↓
Reports
↓
Integrations
↓
Marketplace
One database.
Multiple capabilities.
Recommended Folder Structure
apps/
↓
modules/
↓
shared/
↓
analytics/
↓
integrations/
↓
core/
↓
platform/
Structure early.
Refactoring later becomes expensive.
Example KPIs To Track
Daily Active Teams
↓
Module Adoption
↓
Workflow Completion
↓
Operational Efficiency
↓
Cross-Module Usage
↓
Retention
↓
Revenue Per Account
These become platform metrics.
How To Build It (MVP Plan)
Phase 1 — Core OS (90 Days)
Build:
✔ Authentication
✔ Dashboard
✔ Organizations
✔ Modules
✔ Shared Database
Launch.
Do not build:
✘ AI
✘ Marketplace
✘ Integrations
✘ Complex automation
Version one should feel unified.
Phase 2 — Operational Expansion
Add:
- inventory
- workforce
- analytics
Phase 3 — Platform Expansion
Add:
- third-party modules
- APIs
- integrations
Phase 4 — Agritech Ecosystem
Add:
- developer platform
- extension marketplace
- automation
Cost-Effective Way To Build
Lean AgriOS Stack
- Frontend: Flutter
- Backend: Supabase
- Database: PostgreSQL
- Hosting: Cloudflare
- Realtime: Supabase
- Analytics: PostHog
- Estimated MVP Cost: $800–$3,000
- Estimated Build Time: 90–180 days
Build one excellent module first.
Then expand.
Monetization
Free
- small operations
Professional
- advanced modules
Enterprise
- multi-location
Additional Revenue:
- marketplace fees
- integrations
- analytics
- consulting
Competitive Advantage Strategy
Most agritech companies build products.
Build infrastructure.
Products compete.
Platforms compound.
Whoever owns the operating layer owns the workflow.
And whoever owns the workflow becomes difficult to replace.
See Also:
You have now seen 25 agribusiness and agritech app ideas.
But ideas are cheap. Execution is expensive.
So the next question is the right one:
Which of these opportunities should you actually build?
As an intermediate Android developer building for Android + iOS + Web, your goal should not be: “Build the biggest idea.”
Your goal should be: Build the smallest valuable system with the highest chance of adoption.
This ranking combines five dimensions:
- Market Demand
- Speed To MVP
- Revenue Potential
- Technical Difficulty
- Expansion Potential
Scoring: 10 = strongest
This ranking is designed from the perspective of:
- Africa
- Nigeria
- Global scalability
- Startup feasibility
- Solo/small-team execution
Frequently Asked Questions (FAQs) About the Best High-Demand + Underserved Agribusiness & Agritech App Ideas to Build
1. What are agribusiness and agritech apps?
Agribusiness and agritech apps are digital platforms designed to solve problems across the agricultural value chain using technology. These apps help farmers, agribusiness owners, processors, logistics operators, investors, and buyers improve productivity, reduce costs, increase transparency, and access markets more efficiently.
Agritech apps can include:
- Farm management apps
- Crop disease detection tools
- Precision agriculture platforms
- Agricultural marketplaces
- Livestock monitoring systems
- Agricultural financing apps
- Food traceability platforms
- Agricultural supply chain software
As agriculture becomes increasingly data-driven, these apps are becoming essential infrastructure for modern food production and distribution.
2. Why are many high-demand agritech app categories still underserved?
Many agritech opportunities remain underserved because agriculture presents unique challenges that traditional software startups often overlook.
Key reasons include:
- Fragmented agricultural markets
- Limited rural internet access
- Seasonal demand cycles
- Difficulty collecting agricultural data
- Low digital literacy among some users
- Complex logistics and supply chains
- High customer acquisition costs
At the same time, these gaps create opportunities for founders who deeply understand farmer behavior and local agricultural realities.
3. How do I identify a profitable agribusiness app idea?
The best agribusiness app ideas usually emerge from expensive, repetitive, and unresolved problems.
A practical framework:
- Find a recurring agricultural problem.
- Validate demand with real users.
- Measure how much time or money is lost.
- Build a simple MVP.
- Test willingness to pay.
Strong indicators of opportunity include:
- Farmers already using spreadsheets or WhatsApp manually.
- Existing solutions being too expensive.
- Users requesting workarounds repeatedly.
- Large agricultural sectors with low software penetration.
The strongest opportunities often solve operational problems rather than simply providing information.
4. Which agritech app categories have the highest future growth potential?
Several categories are expected to experience significant growth over the next decade:
- AI-powered crop advisory platforms
- Precision agriculture systems
- Climate adaptation tools
- Agricultural fintech and embedded lending
- Farm-to-market logistics apps
- Agricultural insurance technology
- Carbon farming platforms
- Traceability and food transparency solutions
- Vertical farming software
- Livestock intelligence platforms
Apps that combine data, automation, and financial services are especially positioned for long-term expansion.
5. Can a solo developer build a successful agritech app?
Yes. Many successful agricultural technology businesses started with a single founder or a very small team.
A solo developer can launch by:
- Building an MVP first
- Targeting one agricultural niche
- Using low-code tools
- Leveraging cloud infrastructure
- Partnering with agricultural cooperatives
The key is not building a large platform immediately—it is solving one painful problem exceptionally well.
6. What features should every agribusiness mobile app include?
While requirements vary, most successful agribusiness apps benefit from these core features:
- Offline functionality
- GPS and location services
- Multi-language support
- Push notifications
- Secure user authentication
- Analytics dashboard
- Image uploads
- Payment integration
- Data synchronization
- Simple onboarding
Agricultural users often operate in environments with limited connectivity, making usability and offline-first design major competitive advantages.
7. How do agritech startups make money?
Agritech businesses commonly use several revenue models:
- Subscription plans
- Commission on marketplace transactions
- Freemium upgrades
- SaaS licensing
- Equipment integration fees
- Data insights services
- Financial products
- Advertising
- API access
Many successful agritech companies combine multiple revenue streams rather than relying on a single monetization method.
8. What technologies are used to build modern agritech apps?
Modern agritech platforms increasingly combine software, hardware, and data technologies.
Popular technologies include:
- Android and cross-platform mobile frameworks
- Artificial Intelligence (AI)
- Machine Learning (ML)
- Cloud computing
- IoT sensors
- Satellite imagery
- GPS mapping
- Computer vision
- Blockchain
- Big data analytics
Choosing technology should follow the business problem—not the other way around.
9. What are the biggest mistakes founders make when building agritech apps?
Common mistakes include:
- Building before validating demand
- Ignoring offline usage
- Copying foreign solutions without localization
- Overcomplicating user interfaces
- Focusing only on farmers instead of the full value chain
- Underestimating distribution and onboarding
The most successful agritech founders spend more time understanding users than writing code.
10. Is now a good time to start an agribusiness or agritech app business?
Yes. Agriculture is undergoing a major digital transformation driven by population growth, climate pressure, food security concerns, mobile adoption, and advances in AI.
Several trends support opportunity:
- Growing smartphone penetration
- Increasing agricultural digitization
- Expanding fintech infrastructure
- Demand for resilient food systems
- Government and private investment in agricultural innovation
Founders who build practical, localized, and economically valuable solutions today may position themselves for long-term growth as agriculture becomes increasingly technology-enabled.